Written by William Farrand, Senior Research Scientist, Space Science Institute Earth planning date: Friday, June 12, 2026 Rather than going from stage to stage at a music festival to hear different bands playing different varieties of music, Curiosity has been ascending up...
3 min read
Curiosity Blog, Sols 4920-4926: Surveying the Bands
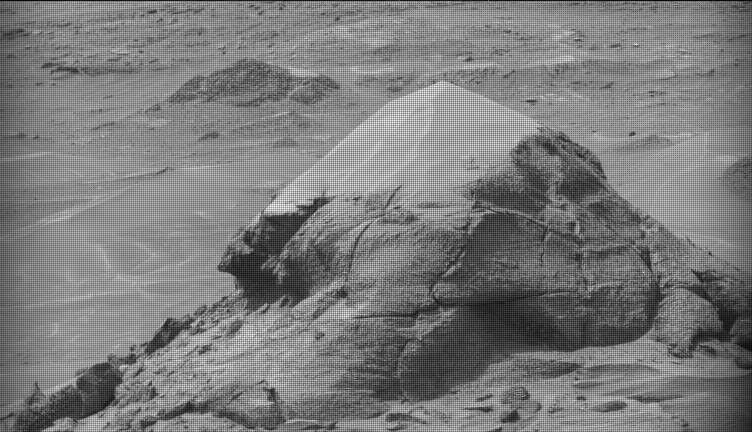
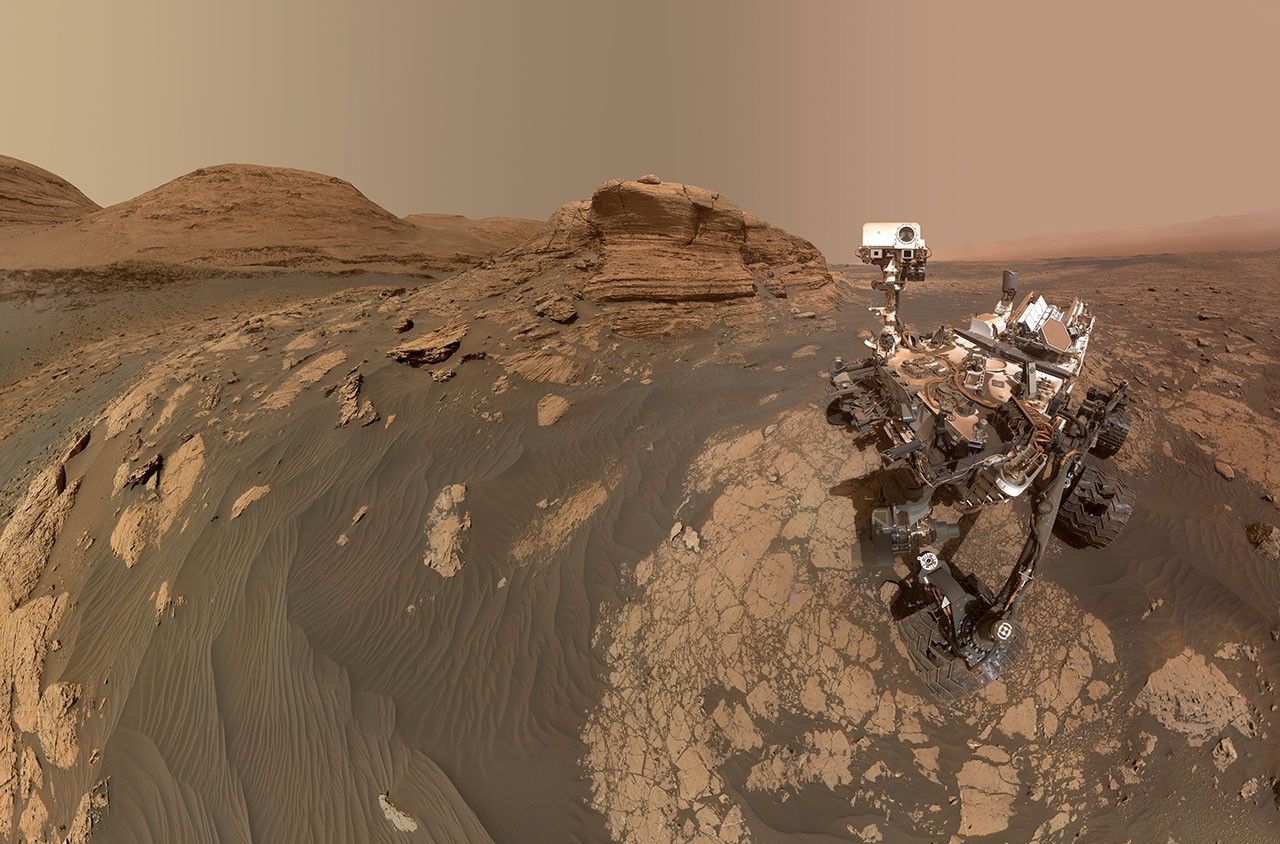
NASA’s Mars rover Curiosity acquired this image of small butte, “Miraflores,” using its Mast Camera (Mastcam) on June 11, 2026 — Sol 4922, or Martian day 4,922 of the Mars Science Laboratory mission — at 09:12:13 UTC.
NASA/JPL-Caltech/MSSS
Written by William Farrand, Senior Research Scientist, Space Science Institute
Earth planning date: Friday, June 12, 2026
Rather than going from stage to stage at a music festival to hear different bands playing different varieties of music, Curiosity has been ascending up Mount Sharp through physical bands of exposed rocks with textural and tonal differences.
Planning for sols 4920 and 4921 were done with the rover in the middle of a unit with a rougher texture and dark-toned bedrock. With the rougher-textured bedrock, brushing wasn’t possible, but APXS chemistry and MAHLI micro-imaging were planned on “as is” bedrock targets “Salto La Cascada” and “Puerto de Rosas.” ChemCam was targeted to perform LIBS spectroscopy on a bedrock target “Kishuara” and a small, layered float rock “La Rosita.” ChemCam’s Remote Micro-Imager (RMI) collected views of the “Mishe Mokwa” butte and another looking at dunes with tonal differences. Mastcam mosaics were collected on the “Valle Grande” channel, “Kimsa Chata” butte, nearby troughs, and the aircraft carrier shaped rock “El Matir.”
Another drive brought Curiosity closer to the upper border of the dark-toned band. Again, brushing of the rocks was not possible, but APXS and MAHLI were collected on dark-toned bedrock targets “Santa Gracia” and “Laguna San Rafael” with ChemCam LIBS also targeting the bedrock. Mastcam mosaics were collected of a layered rock and nearby troughs and a mosaic of the nearby smaller butte, “Miraflores” which displays an interesting layered structure with ragged dark-toned rocks on one side and a stack of dust piled on top (see accompanying image). Other activities included a long-distance RMI mosaic of a bright unit on “Mishe Mokwa”, and Navcam dust-devil surveys in both sols.
Communicating between Earth and Mars has come to seem routine, but at times can still be a challenging endeavor and this was demonstrated to the team on Friday when we did not get a timely downlink of data for the drive planned for Sol 4923. Without these images another drive, in situ examinations, or targeted remote sensing could not be planned. However, there are always interesting things to be done on Mars and the three-sol plan (4924 to 4926) included a 360-degree Mastcam mosaic, the automatic AEGIS targeting of LIBS measurements on each sol, a Navcam dust-devil survey, APXS atmospheric measurements, as well as several other environmental activities.
On Monday, the delayed downlink will be used to plan the first investigation of the next band of surface materials, this one being smooth-textured and light-toned, as well as another drive to continue the surveying of the bands.
Written by William Farrand, Senior Research Scientist, Space Science Institute Earth planning date: Friday, June 12, 2026 Rather than going from stage to stage at a music festival to hear different bands playing different varieties of music, Curiosity has been ascending up...
3 min read
Curiosity Blog, Sols 4920-4926: Surveying the Bands
NASA’s Mars rover Curiosity acquired this image of small butte, “Miraflores,” using its Mast Camera (Mastcam) on June 11, 2026 — Sol 4922, or Martian day 4,922 of the Mars Science Laboratory mission — at 09:12:13 UTC.
NASA/JPL-Caltech/MSSS
Written by William Farrand, Senior Research Scientist, Space Science Institute
Earth planning date: Friday, June 12, 2026
Rather than going from stage to stage at a music festival to hear different bands playing different varieties of music, Curiosity has been ascending up Mount Sharp through physical bands of exposed rocks with textural and tonal differences.
Planning for sols 4920 and 4921 were done with the rover in the middle of a unit with a rougher texture and dark-toned bedrock. With the rougher-textured bedrock, brushing wasn’t possible, but APXS chemistry and MAHLI micro-imaging were planned on “as is” bedrock targets “Salto La Cascada” and “Puerto de Rosas.” ChemCam was targeted to perform LIBS spectroscopy on a bedrock target “Kishuara” and a small, layered float rock “La Rosita.” ChemCam’s Remote Micro-Imager (RMI) collected views of the “Mishe Mokwa” butte and another looking at dunes with tonal differences. Mastcam mosaics were collected on the “Valle Grande” channel, “Kimsa Chata” butte, nearby troughs, and the aircraft carrier shaped rock “El Matir.”
Another drive brought Curiosity closer to the upper border of the dark-toned band. Again, brushing of the rocks was not possible, but APXS and MAHLI were collected on dark-toned bedrock targets “Santa Gracia” and “Laguna San Rafael” with ChemCam LIBS also targeting the bedrock. Mastcam mosaics were collected of a layered rock and nearby troughs and a mosaic of the nearby smaller butte, “Miraflores” which displays an interesting layered structure with ragged dark-toned rocks on one side and a stack of dust piled on top (see accompanying image). Other activities included a long-distance RMI mosaic of a bright unit on “Mishe Mokwa”, and Navcam dust-devil surveys in both sols.
Communicating between Earth and Mars has come to seem routine, but at times can still be a challenging endeavor and this was demonstrated to the team on Friday when we did not get a timely downlink of data for the drive planned for Sol 4923. Without these images another drive, in situ examinations, or targeted remote sensing could not be planned. However, there are always interesting things to be done on Mars and the three-sol plan (4924 to 4926) included a 360-degree Mastcam mosaic, the automatic AEGIS targeting of LIBS measurements on each sol, a Navcam dust-devil survey, APXS atmospheric measurements, as well as several other environmental activities.
On Monday, the delayed downlink will be used to plan the first investigation of the next band of surface materials, this one being smooth-textured and light-toned, as well as another drive to continue the surveying of the bands.
Description A prototype four-wheel rover developed at NASA’s Jet Propulsion Laboratory with advanced mobility and robotic autonomy capabilities trundled across the Colorado Desert near Plaster City, California, during a field test in March 2026. Called ERNEST (Exploration...
2 Min Read
Desert Field Test With NASA Advanced Rover Prototype
PIA26701
Credits: NASA/JPL-Caltech
Downloads
Desert Field Test With NASA Advanced Rover Prototype
PNG (27.94 MB)
PIA26701 Figure A
JPEG (26.03 MB)
PIA26701 Figure B
JPEG (951.75 KB)
PIA26701 Figure C
JPEG (16.03 MB)
PIA26701 Figure D
JPEG (16.46 MB)
Description
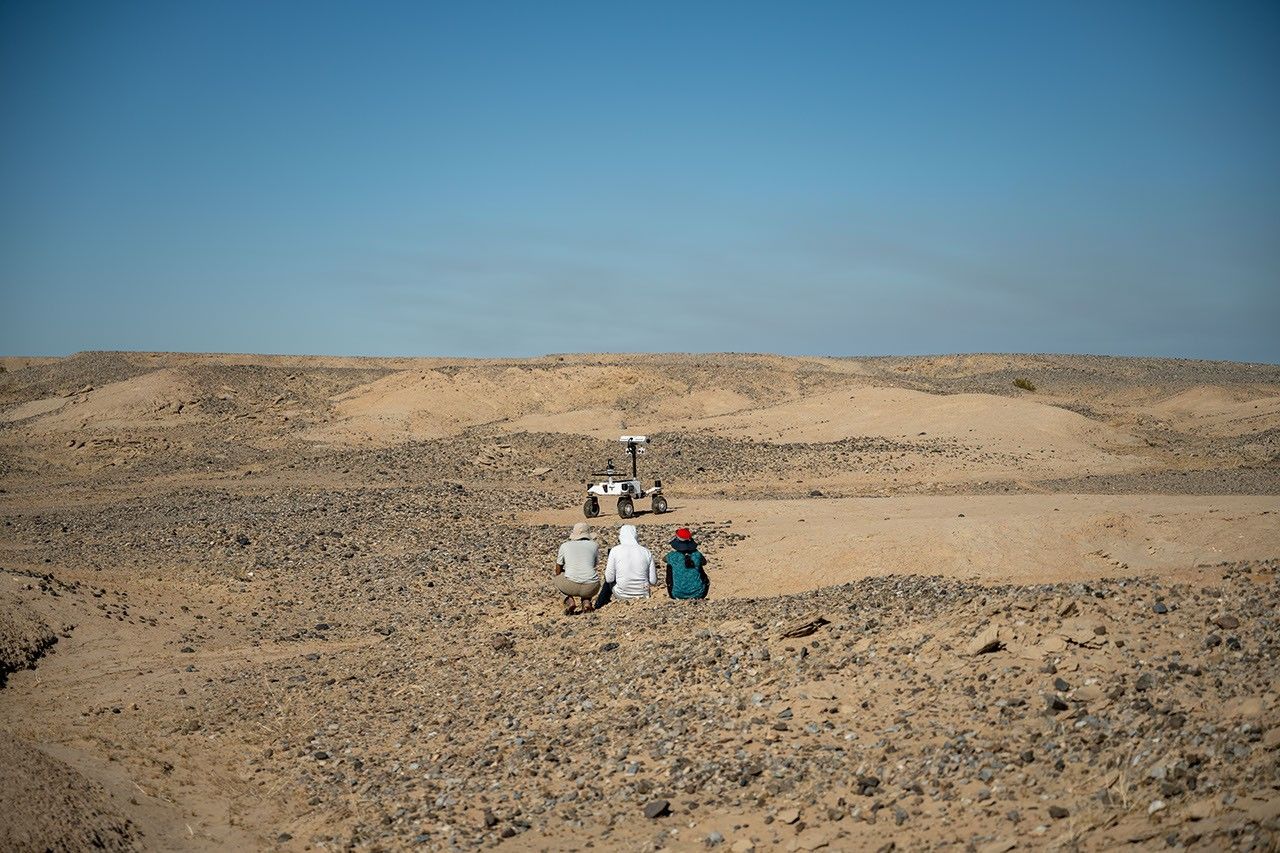
A prototype four-wheel rover developed at NASA’s Jet Propulsion Laboratory with advanced mobility and robotic autonomy capabilities trundled across the Colorado Desert near Plaster City, California, during a field test in March 2026. Called ERNEST (Exploration Rover for Navigating Extreme Sloped Terrain), the rover served here as a testbed for autonomy software developed for a potential lunar mission requiring higher speeds and much greater mileage than can be achieved with current planetary rovers.
ERNEST was trailed by engineers as it traveled about 16 miles over the course of 37 hours of drive time. That’s more than 10 times the speed at which NASA’s Perseverance rover can navigate on Mars. The team also tested how well the rover traveled at dusk, dawn, and nighttime to simulate the experience of large terrain shadows in polar regions on the Moon.
Figure A
Figure A shows the rover traveling toward its shadow.
Figure B
Figure B shows two team members setting up illuminators on the rover at night.
Figure C
Figure C shows three team members observing the rover during its long-range traverse.
Figure D
Figure D shows the rover with one wheel up on a rock.
Work on ERNEST began in 2022 and was initially supported by JPL internal research and development funds. It is currently funded by NASA’s Mars Exploration Program and the agency’s Exploration Science Strategy Integration Office under its Science Mission Directorate in Washington. Caltech in Pasadena, California, manages JPL for NASA.
Description A prototype four-wheel rover developed at NASA’s Jet Propulsion Laboratory with advanced mobility and robotic autonomy capabilities trundled across the Colorado Desert near Plaster City, California, during a field test in March 2026. Called ERNEST (Exploration...
2 Min Read
Desert Field Test With NASA Advanced Rover Prototype
PIA26701
Credits: NASA/JPL-Caltech
Downloads
Desert Field Test With NASA Advanced Rover Prototype
PNG (27.94 MB)
PIA26701 Figure A
JPEG (26.03 MB)
PIA26701 Figure B
JPEG (951.75 KB)
PIA26701 Figure C
JPEG (16.03 MB)
PIA26701 Figure D
JPEG (16.46 MB)
Description
A prototype four-wheel rover developed at NASA’s Jet Propulsion Laboratory with advanced mobility and robotic autonomy capabilities trundled across the Colorado Desert near Plaster City, California, during a field test in March 2026. Called ERNEST (Exploration Rover for Navigating Extreme Sloped Terrain), the rover served here as a testbed for autonomy software developed for a potential lunar mission requiring higher speeds and much greater mileage than can be achieved with current planetary rovers.
ERNEST was trailed by engineers as it traveled about 16 miles over the course of 37 hours of drive time. That’s more than 10 times the speed at which NASA’s Perseverance rover can navigate on Mars. The team also tested how well the rover traveled at dusk, dawn, and nighttime to simulate the experience of large terrain shadows in polar regions on the Moon.
Figure A
Figure A shows the rover traveling toward its shadow.
Figure B
Figure B shows two team members setting up illuminators on the rover at night.
Figure C
Figure C shows three team members observing the rover during its long-range traverse.
Figure D
Figure D shows the rover with one wheel up on a rock.
Work on ERNEST began in 2022 and was initially supported by JPL internal research and development funds. It is currently funded by NASA’s Mars Exploration Program and the agency’s Exploration Science Strategy Integration Office under its Science Mission Directorate in Washington. Caltech in Pasadena, California, manages JPL for NASA.
Even small asteroids lead complex lives. During its flyby of the asteroid Donaldjohanson last year, NASA’s Lucy spacecraft revealed the asteroid to be a wobbly, peanut-shaped body that has undergone a lot of activity in its relatively short history. Formed as fragments...
Even small asteroids lead complex lives. During its flyby of the asteroid Donaldjohanson last year, NASA’s Lucy spacecraft revealed the asteroid to be a wobbly, peanut-shaped body that has undergone a lot of activity in its relatively short history. Formed as fragments coalesced after a violent collision 155 million years ago, the asteroid was transformed by the small but inexorable force of the Sun’s radiation, all while retaining signs of the brief presence of liquid water in its distant past.
Zooming through the main asteroid belt toward one of the Jupiter Trojan asteroid groups, the Lucy spacecraft collected the first close-up images and other data at Donaldjohanson on April 20, 2025, as it passed 650 miles away from the asteroid. The data revealed that, instead of spinning simply around one axis like most other asteroids and planets, Donaldjohanson has a more complicated two-axis rotation. Scientists also saw Donaldjohanson’s peanut shape and the craters and ridges on its surface.
A timelapse video made from images taken by NASA’s Lucy spacecraft as it approached the asteroid Donaldjohanson on April 20, 2025. The L’LORRI (Lucy Long Range Reconnaissance Imager) instrument, the spacecraft’s high-resolution black-and-white imager, collected these images over two hours as the spacecraft rapidly closed in on the asteroid from an initial separation of more than 58,000 miles (93,000 km), until the spacecraft passed a mere 650 miles (1000 km) from the 5-mile- (8 km-) wide asteroid.
NASA/Goddard/SwRI/JHU-APL
Lucy’s encounter with the asteroid was planned as a dress rehearsal for the spacecraft and mission team before its primary asteroid encounters, which begin with Lucy’s flyby of the Trojan asteroid Eurybates on Aug. 12, 2027. The instruments performed as expected, and, as a bonus, scientists got a rare opportunity to study a previously unexplored asteroid up close and to compare it to two asteroids with similar compositions but different histories: Bennu, the target of NASA’s OSIRIS-REx sample-return mission, and Ryugu, the site of JAXA’s (Japan Aerospace Exploration Agency) Hayabusa2 sample-return mission.
With Earth-based telescopes, observers saw fluctuations in the light Donaldjohanson reflects, regular patterns of peaks and valleys, typical of an elongated object rotating once every 10.5 Earth days. But Lucy’s data revealed another pattern: Donaldjohanson appears to be rotating like a wobbly top. Paper authors reported that the asteroid rotates end-over-end once every 10.5 Earth days, and wobbles back and forth around its long axis once every 26.5 days.
The asteroid Donaldjohanson is shown slowly rotating in a tumbling, non-principal axis motion, with its angular momentum vector and rotation axes indicated. The surface is colored by gravity slope, which measures the angle between the local surface and the direction of gravity. Higher values (warmer colors) indicate steeper terrain relative to the local gravitational pull. Regions with limited stereo image coverage have been masked out where the shape model is less well constrained.
Kel Elkins/NASA’s Science Visualization Studio/DLR
Peanut shape
While the Earth-based observations hinted at Donaldjohanson’s elongated shape, the Lucy flyby revealed a “bilobate” structure: two lobes connected by a neck, like a peanut. These lobes are likely two fragments from an asteroid collision that gently came together afterward by their mutual gravity.
Donaldjohanson likely rotated at least 10 times faster when it formed, having slowed to its current rate in the last 20 to 60 million years, the team estimates. As it slowed, the balance between the centrifugal force pushing things apart and gravity pulling things together changed and loose rocky material slid down slopes creating the worn-down appearance of many craters, as the flyby images showed.
The paper’s authors say that the asteroid’s slowing rotation is likely caused by a subtle consequence of solar heating known as the YORP effect. Each part of the asteroid’s Sun-warmed surface radiates heat away as infrared light, and that radiation imparts a tiny recoil force to the surface. Because the asteroid’s shape isn’t symmetric, this results in a net torque, or twist, that can change the asteroid’s rotation. Thus, YORP can slow asteroid spins down or speed them up, as in the case of Bennu (once every four hours) and Ryugu (once about every seven hours), which both likely used to rotate much slower than they do today.
Fleeting water
As it passed by Donaldjohanson at 30,000 mph, Lucy recorded the signatures of iron-rich clay minerals on the surface. These clays must have formed in the distant past with the help of liquid water. However, the exposure must have been brief, Lucy scientists concluded, because iron in clays tends to be replaced with other elements, such as magnesium, as water lingers.
Indeed, scientists saw magnesium-rich clays at Bennu and Ryugu, which suggested prolonged water exposure, perhaps lasting millions of years, when they were still part of larger asteroids.
This difference in water exposure history, and other characteristics, may mean that the parent bodies of these asteroids formed at different times or in different regions of the solar system before relocating to the main belt.
Compare, contrast
Donaldjohanson is thought to be made from rocky remnants of a larger, carbon- and water-rich asteroid that collided with another object in the main asteroid belt. Bennu and Ryugu are thought to have formed in the same way and in the same region.
But Donaldjohanson is different. At 155 million years old, it is much younger than Bennu and Ryugu, which formed 1 to 2 billion years ago. Donaldjohanson also has remained in the asteroid belt since birth, while its wandering cousins migrated into orbits around the Sun that bring them close to Earth’s orbit about once a year (which made them perfect close targets for sample return missions).
During its April 20, 2025, encounter with the main-belt asteroid Donaldjohanson, NASA’s Lucy spacecraft discovered evidence for iron-rich clays on the surface using its infrared spectrometer. These clays, which are similar to those found in carbon-rich meteorites such as QUE 97990, indicate that water was briefly present in the asteroid during the distant past.
NASA/Goddard/SwRI/Dan Gallagher
“It’s helpful for scientists to compare Donaldjohanson with asteroids like Bennu and Ryugu, which are seemingly similar asteroids, because every subtle difference is another clue to our origin story,” said Simone Marchi, Lucy deputy principal investigator and lead author of the study at the Boulder, Colorado, office of the Southwest Research Institute.
“Once we start learning more about the Trojans, a completely different population of space rocks with very different histories, our understanding of solar system formation is destined to be challenged,” said Marchi.
Named after a fossilized skeleton of a human ancestor discovered in Ethiopia in 1974, NASA’s Lucy will be the first mission to explore Jupiter’s Trojan asteroids, a population of well-preserved space rocks that formed early in our solar system’s history and could help scientists understand how the planets formed and moved around before settling in their current configuration.
Lucy’s principal investigator is based out of the Boulder, Colorado, branch of Southwest Research Institute, headquartered in San Antonio. NASA’s Goddard Space Flight Center in Greenbelt, Maryland, provides overall mission management, systems engineering, and safety and mission assurance. Lockheed Martin Space in Littleton, Colorado, built the spacecraft. Lucy is the 13th mission in NASA’s Discovery Program. NASA’s Marshall Space Flight Center in Huntsville, Alabama, manages the Discovery Program for the agency’s Science Mission Directorate in Washington.
For more information on NASA’s Lucy mission, visit:
Zooming through the main asteroid belt toward one of the Jupiter Trojan asteroid groups, the Lucy spacecraft collected the first close-up images and other data at Donaldjohanson on April 20, 2025, as it passed 650 miles away from the asteroid. The data revealed that, instead of spinning simply around one axis like most other asteroids and planets, Donaldjohanson has a more complicated two-axis rotation. Scientists also saw Donaldjohanson’s peanut shape and the craters and ridges on its surface.
This NASA Hubble Space Telescope image features a galaxy cluster, called CL0016+1609 or MACS J0018.5+1626, that is very bright at X-ray wavelengths and is one of the most extensively studied clusters at X-ray and radio wavelengths. The X-ray observations of this cluster...
2 min read
Hubble Glimpses Merging Galaxy Clusters
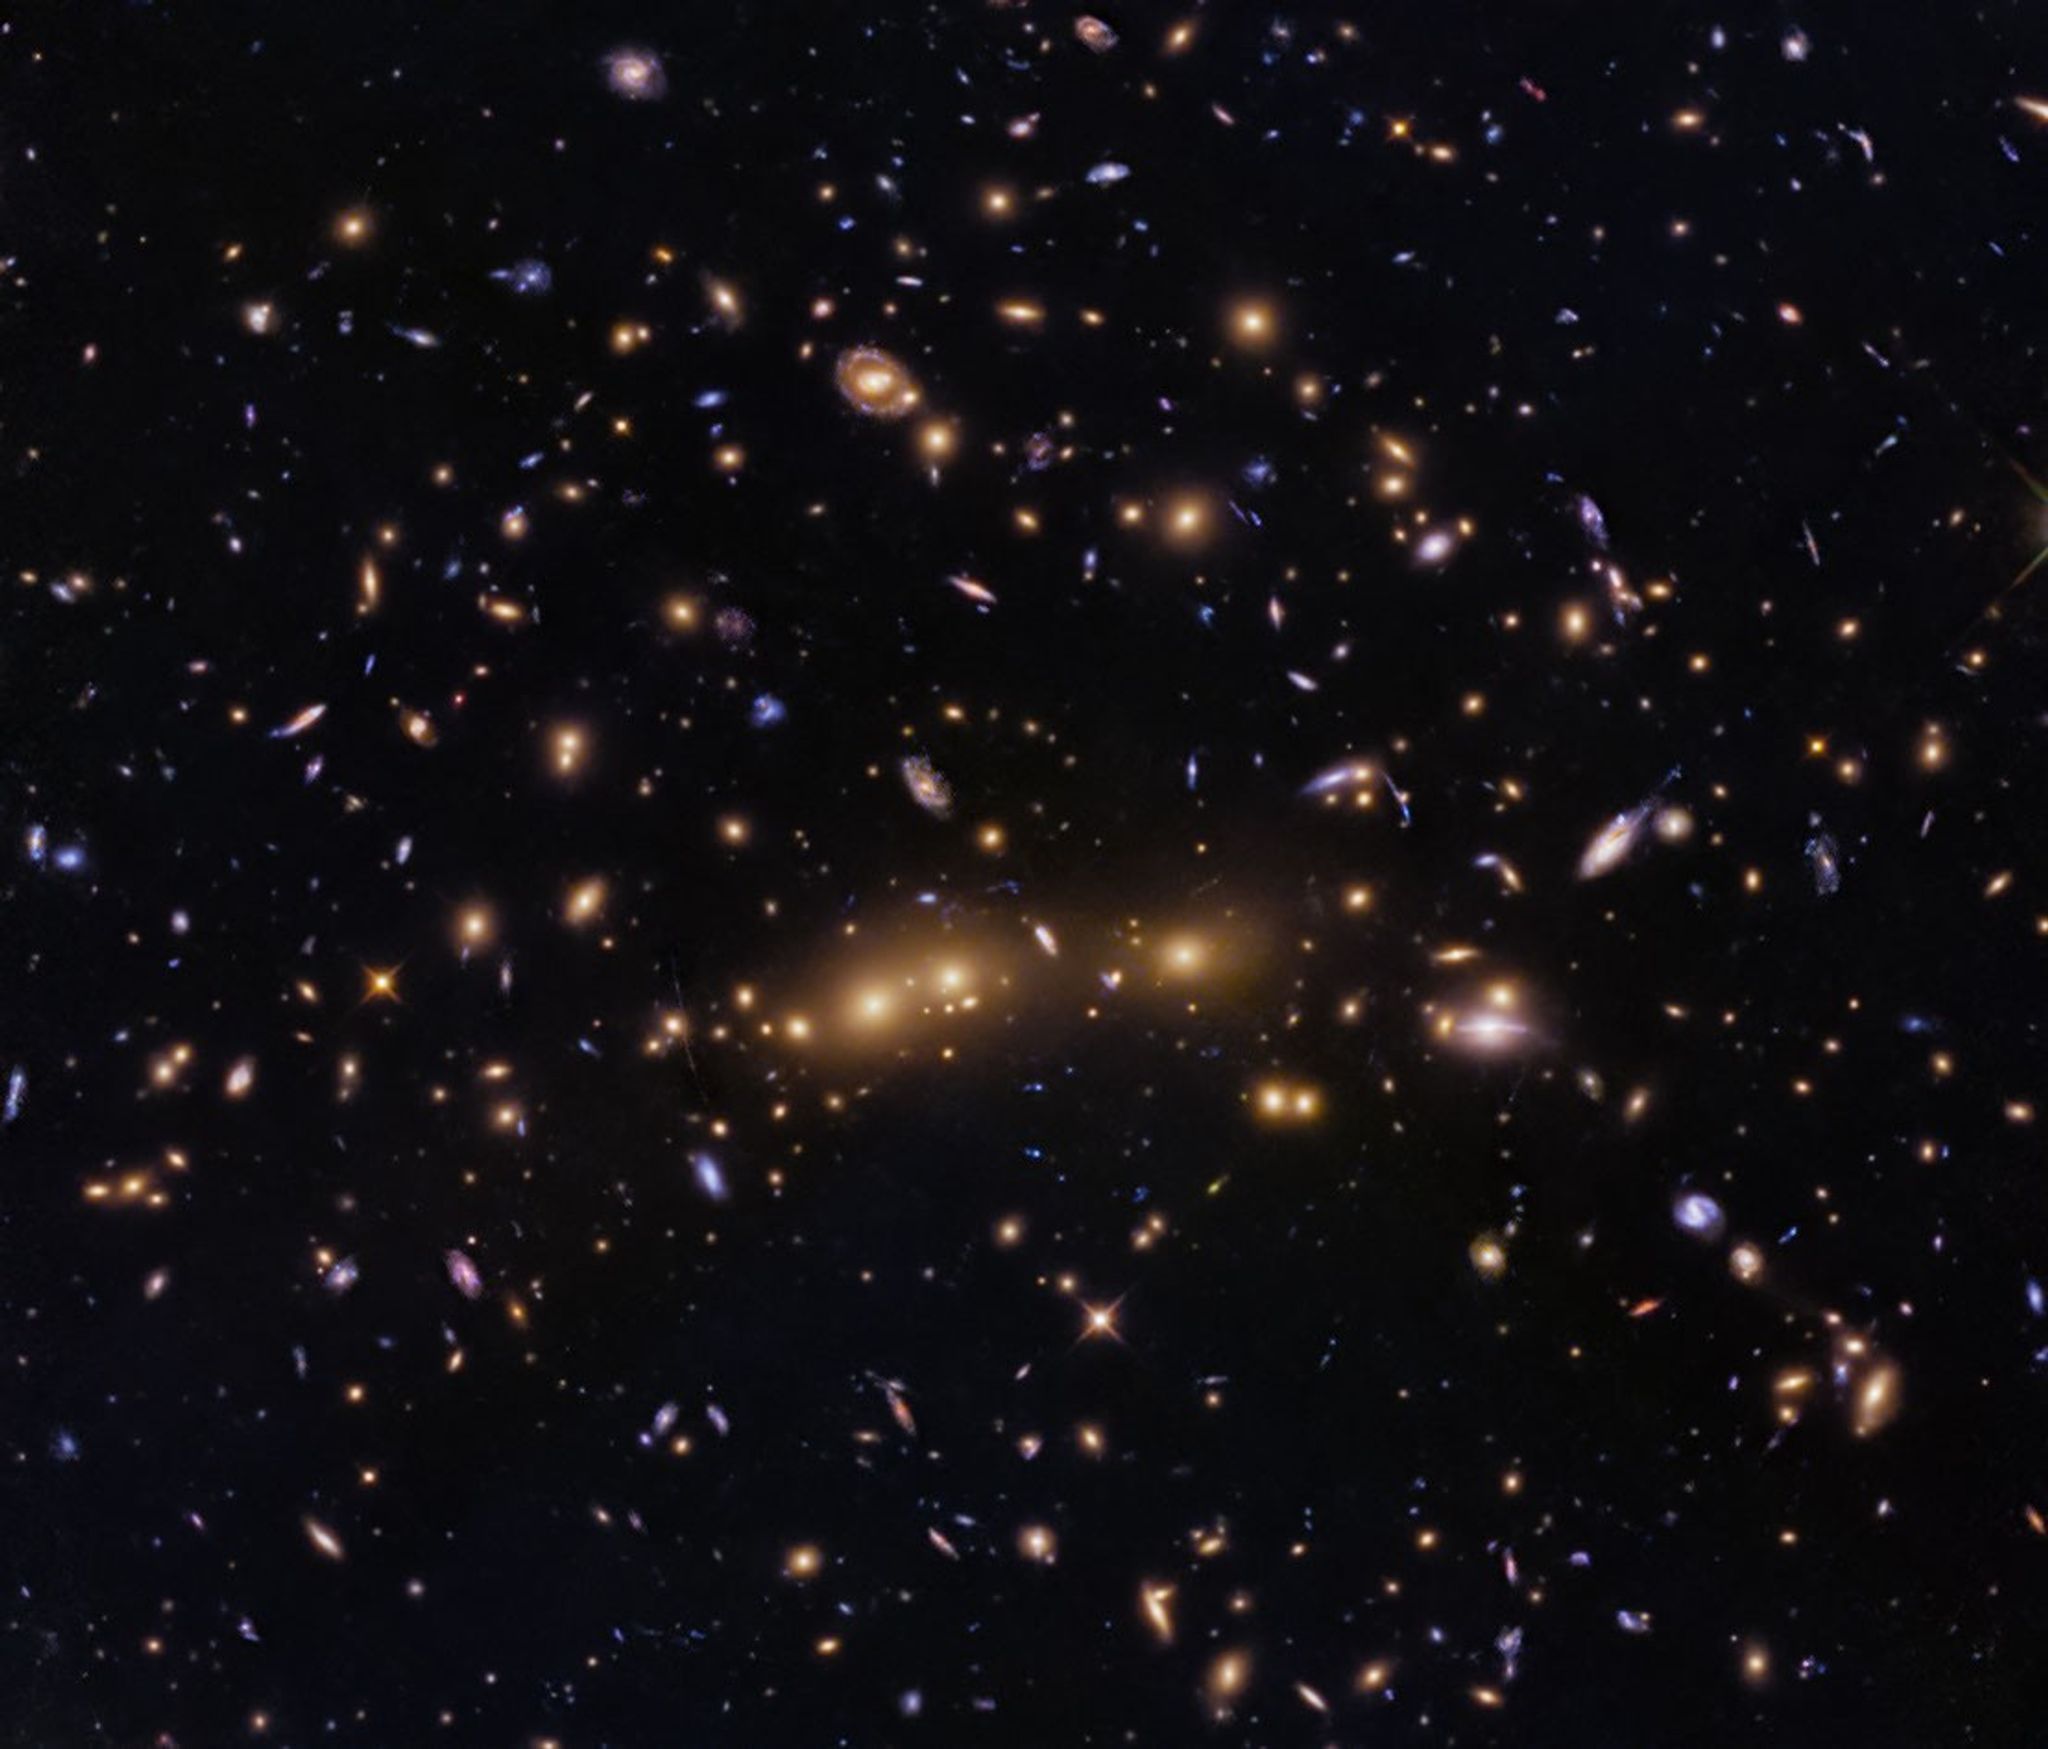
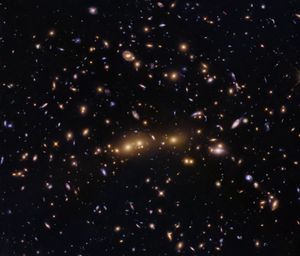
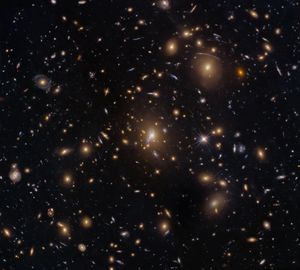
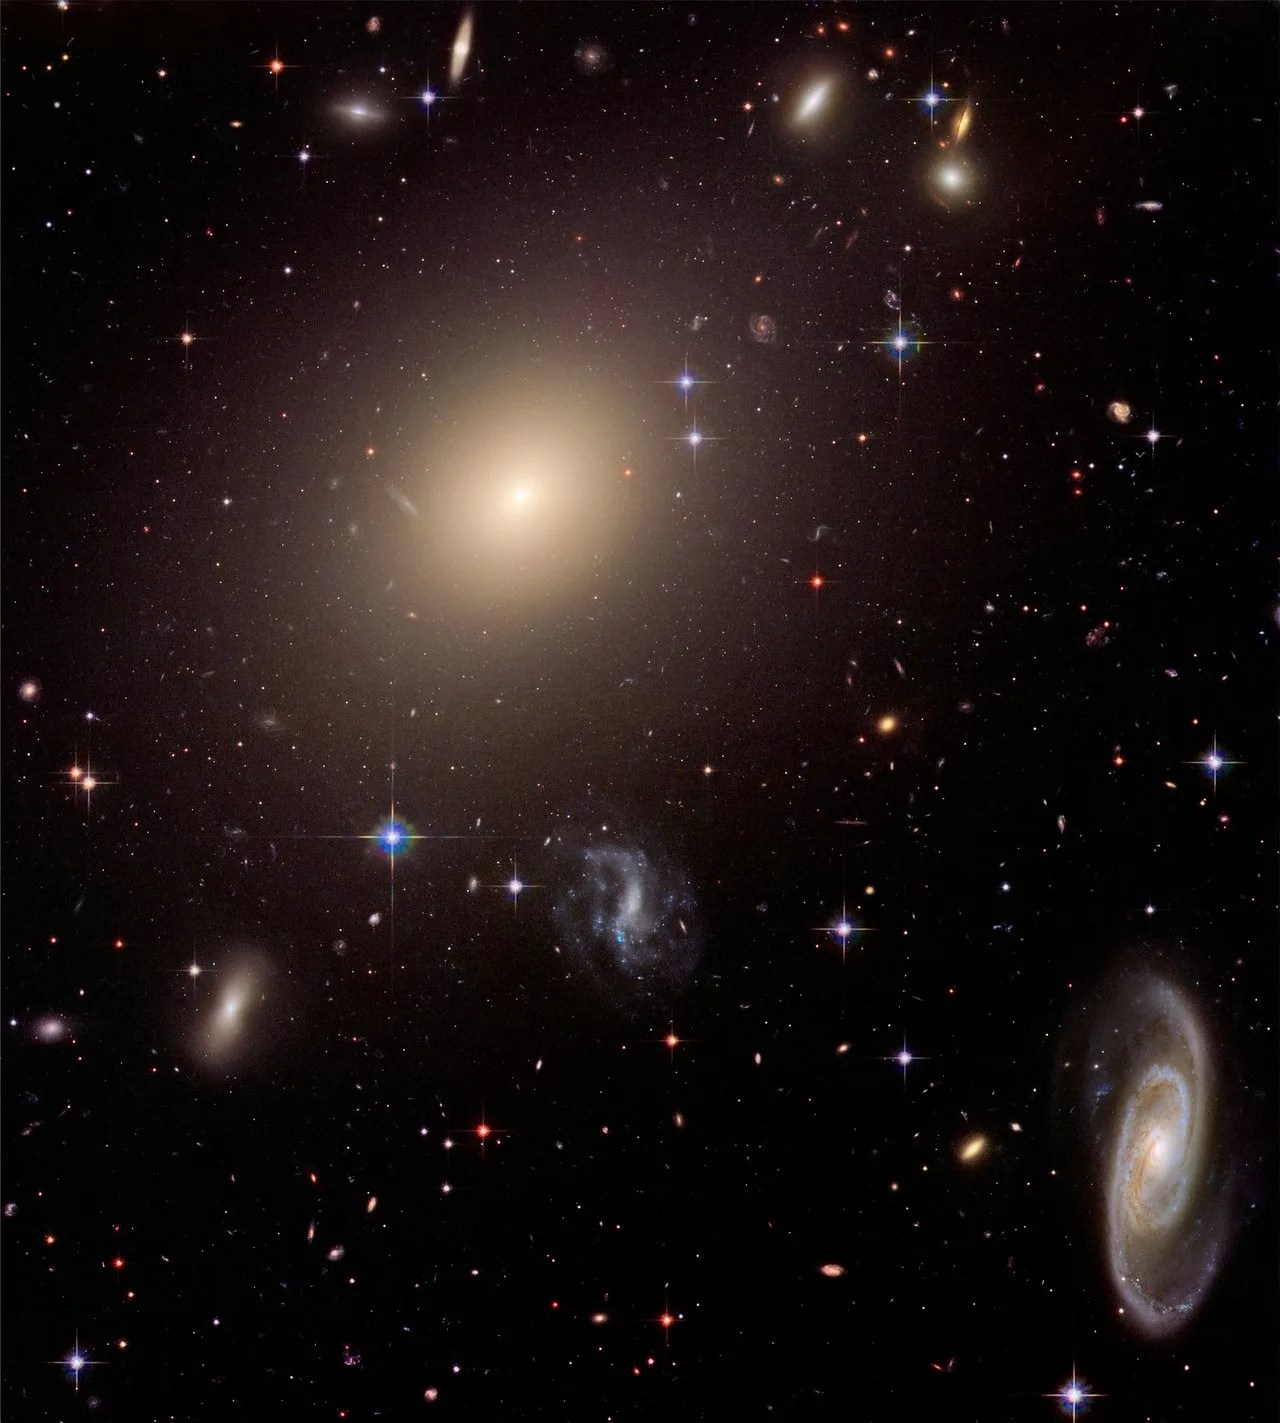
This NASA Hubble Space Telescope image features a swarm of galaxies in the galaxy cluster called CL0016+1609 or MACS J0018.5+1626.
NASA, ESA, H. Ebeling (University of Hawaii), D. Coe (STScI, ESA, JWST); Image Processing: G. Kober (NASA/Catholic University of America)
This NASA Hubble Space Telescope image features a galaxy cluster, called CL0016+1609 or MACS J0018.5+1626, that is very bright at X-ray wavelengths and is one of the most extensively studied clusters at X-ray and radio wavelengths. The X-ray observations of this cluster revealed that it is two clusters merging along our line of sight.
Researchers requested time to observe CL0016+1609 with Hubble’s Advanced Camera for Surveys because that data would help them accurately measure the cluster’s dark-matter distribution, which helps them study the merger and the role of CL0016+1609 in the large-scale structure of the universe. Hubble can’t directly see dark matter, but its infrared and visible light observations can detect dark matter’s gravitational lensing effects on the normal matter Hubble observes.
The data in this image also includes observations with Hubble’s Wide Field Camera 3 taken as part of an observing program that obtained the first Hubble infrared images of 46 massive galaxy clusters and looked for distant galaxies gravitationally lensed by these clusters. Called RELICS (Reionization Lensing Cluster Survey), this survey found some 300 high-redshift candidate galaxies lensed by these clusters.
You can see the faint vertical arc of one of these distant galaxies in the image above. Look for it just to the left of the large elliptical galaxies in the center of the image. Another brighter, though shorter arc is visible just above and to the right of the large elliptical galaxies in the center of the image.
This NASA Hubble Space Telescope image features a galaxy cluster, called CL0016+1609 or MACS J0018.5+1626, that is very bright at X-ray wavelengths and is one of the most extensively studied clusters at X-ray and radio wavelengths. The X-ray observations of this cluster...
2 min read
Hubble Glimpses Merging Galaxy Clusters
This NASA Hubble Space Telescope image features a swarm of galaxies in the galaxy cluster called CL0016+1609 or MACS J0018.5+1626.
NASA, ESA, H. Ebeling (University of Hawaii), D. Coe (STScI, ESA, JWST); Image Processing: G. Kober (NASA/Catholic University of America)
This NASA Hubble Space Telescope image features a galaxy cluster, called CL0016+1609 or MACS J0018.5+1626, that is very bright at X-ray wavelengths and is one of the most extensively studied clusters at X-ray and radio wavelengths. The X-ray observations of this cluster revealed that it is two clusters merging along our line of sight.
Researchers requested time to observe CL0016+1609 with Hubble’s Advanced Camera for Surveys because that data would help them accurately measure the cluster’s dark-matter distribution, which helps them study the merger and the role of CL0016+1609 in the large-scale structure of the universe. Hubble can’t directly see dark matter, but its infrared and visible light observations can detect dark matter’s gravitational lensing effects on the normal matter Hubble observes.
The data in this image also includes observations with Hubble’s Wide Field Camera 3 taken as part of an observing program that obtained the first Hubble infrared images of 46 massive galaxy clusters and looked for distant galaxies gravitationally lensed by these clusters. Called RELICS (Reionization Lensing Cluster Survey), this survey found some 300 high-redshift candidate galaxies lensed by these clusters.
You can see the faint vertical arc of one of these distant galaxies in the image above. Look for it just to the left of the large elliptical galaxies in the center of the image. Another brighter, though shorter arc is visible just above and to the right of the large elliptical galaxies in the center of the image.
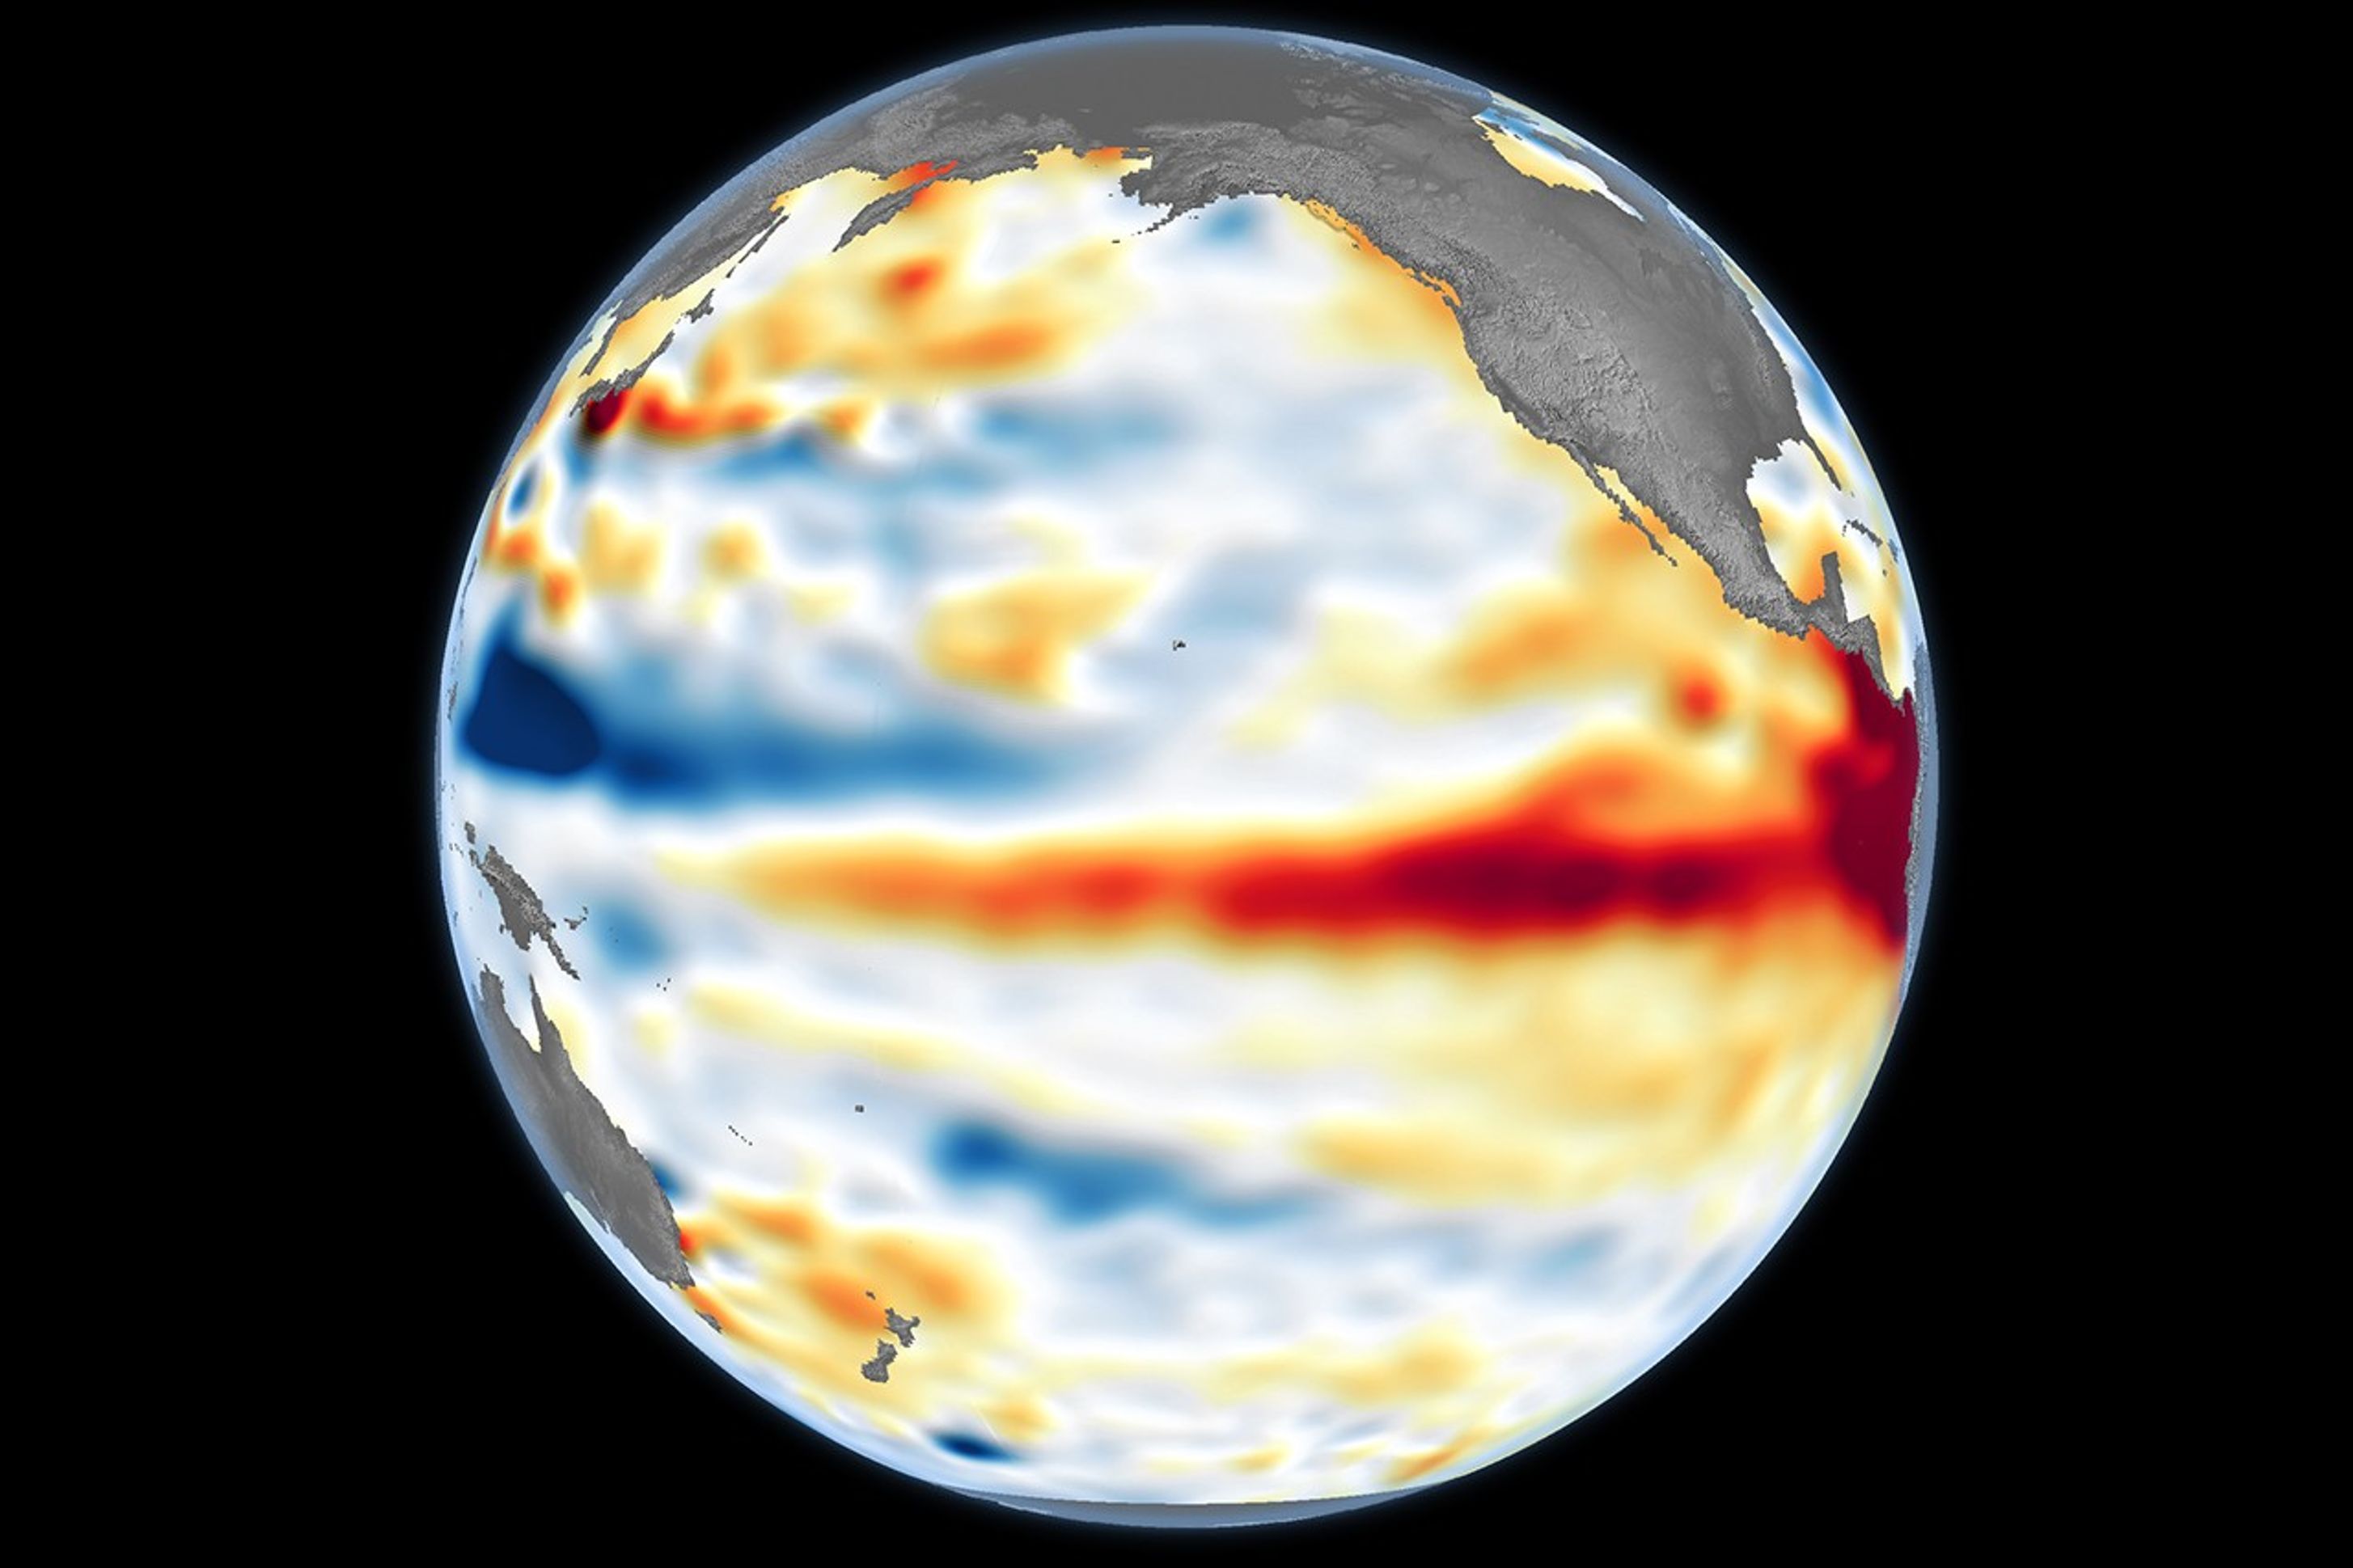
Satellite observations of sea surface height indicated that the 2026 event continued to strengthen in early June.
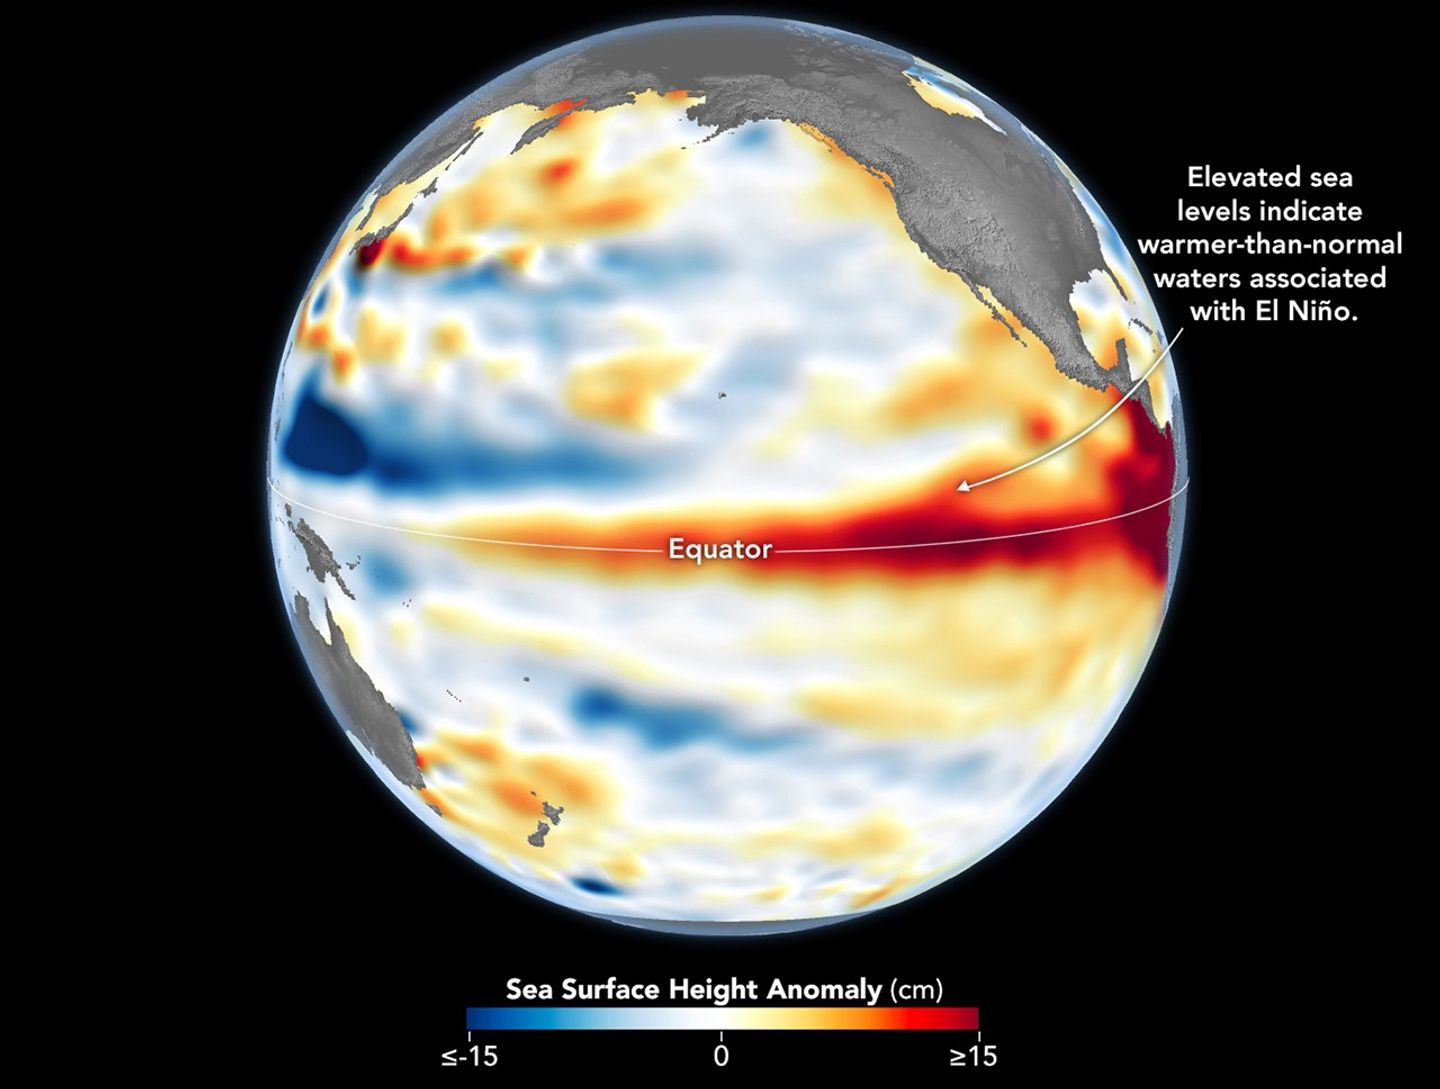
Higher-than-normal sea surfaces (red) are visible in the central and eastern Pacific on June 8, 2026, a few days before El Niño was declared. Data for the map were acquired by the Sentinel-6 Michael Freilich satellite and processed by scientists at NASA’s Jet Propulsion Laboratory (JPL).
NASA Earth Observatory/Lauren Dauphin
El Niño, characterized by warmer-than-normal water temperatures in parts of the equatorial Pacific, made its return in June 2026. Observations of sea surface height from the Sentinel-6 Michael Freilich satellite that month indicated that the 2026 event was continuing to strengthen.
The natural, recurring phenomenon can have widespread effects, typically bringing wetter conditions to the U.S. Southwest and drought to countries in the western Pacific, such as Indonesia and Australia. NOAA declared an El Niño on June 11, after sea surface temperatures in the central and eastern equatorial Pacific measured at least 0.5 degrees Celsius above average for several consecutive months.
Meanwhile, NASA scientists have been observing a complementary sign of El Niño: areas of elevated sea surface height. When ocean water warms, it expands in volume and causes the sea surface to rise—making the water’s height a reliable indicator of ocean temperatures. Warmer-than-normal temperatures, hence higher sea surface heights, in parts of the equatorial Pacific Ocean are associated with El Niño.
The map above depicts sea surface height anomalies across the central and eastern Pacific Ocean as observed on June 8, 2026. Shades of red indicate sea levels that were higher than average. Normal sea level conditions appear white, and lower areas are blue.
Data for the map were acquired by the Sentinel-6 Michael Freilich satellite—launched in 2020 by NASA and led by ESA (European Space Agency)—and processed by scientists at NASA’s Jet Propulsion Laboratory (JPL). Note that signals related to seasonal cycles and long-term trends have been removed to highlight sea level anomalies associated with El Niño and other short-term natural phenomena.
Earlier in spring 2026, the satellite started to detect precursor signs of El Niño as swells of warm water hundreds of miles wide, known as Kelvin waves, moved from the western Pacific to the eastern Pacific. That happens when trade winds in the western equatorial Pacific weaken and then temporarily reverse to blow from the west. Warm water piles up in the east, deepening the warm surface layer, lowering the thermocline, and suppressing the upwelling that usually keeps waters along the Pacific coasts of the Americas cooler.
This buildup of heat beneath the water’s surface is what sea surface height observations capture. It goes beyond surface temperature measurements to indicate how much heat is stored in the subsurface. That’s important because a shallow warm layer might not have much impact on climate and weather, while a large reservoir of heat below the surface can matter more.
According to JPL sea level researcher Severine Fournier, deputy project scientist for Sentinel-6 Michael Freilich, conditions in the western Pacific on June 8 looked similar to those from the same time in 1997, a year when an exceptionally strong El Niño emerged. Warm conditions in the eastern Pacific in 2026 have lagged behind, however, with fewer Kelvin waves built up by the same date.
Still, more warm Kelvin waves appeared to be approaching the eastern Pacific, meaning El Niño was still strengthening. Whether it catches up to 1997 depends on ocean activity in the coming weeks. “For now, it looks like it’s going to be a big one—more so than I would have said last week—but we still need more observations to know what’s going to happen.”
NASA Earth Observatory image by Lauren Dauphin, using modified Copernicus Sentinel data (2023) processed by the European Space Agency and further processed by Josh Willis, Severin Fournier, and Kevin Marlis/NASA/JPL-Caltech. Story by Kathryn Hansen.
Satellite observations of sea surface height indicated that the 2026 event continued to strengthen in early June.
Higher-than-normal sea surfaces (red) are visible in the central and eastern Pacific on June 8, 2026, a few days before El Niño was declared. Data for the map were acquired by the Sentinel-6 Michael Freilich satellite and processed by scientists at NASA’s Jet Propulsion Laboratory (JPL).
NASA Earth Observatory/Lauren Dauphin
El Niño, characterized by warmer-than-normal water temperatures in parts of the equatorial Pacific, made its return in June 2026. Observations of sea surface height from the Sentinel-6 Michael Freilich satellite that month indicated that the 2026 event was continuing to strengthen.
The natural, recurring phenomenon can have widespread effects, typically bringing wetter conditions to the U.S. Southwest and drought to countries in the western Pacific, such as Indonesia and Australia. NOAA declared an El Niño on June 11, after sea surface temperatures in the central and eastern equatorial Pacific measured at least 0.5 degrees Celsius above average for several consecutive months.
Meanwhile, NASA scientists have been observing a complementary sign of El Niño: areas of elevated sea surface height. When ocean water warms, it expands in volume and causes the sea surface to rise—making the water’s height a reliable indicator of ocean temperatures. Warmer-than-normal temperatures, hence higher sea surface heights, in parts of the equatorial Pacific Ocean are associated with El Niño.
The map above depicts sea surface height anomalies across the central and eastern Pacific Ocean as observed on June 8, 2026. Shades of red indicate sea levels that were higher than average. Normal sea level conditions appear white, and lower areas are blue.
Data for the map were acquired by the Sentinel-6 Michael Freilich satellite—launched in 2020 by NASA and led by ESA (European Space Agency)—and processed by scientists at NASA’s Jet Propulsion Laboratory (JPL). Note that signals related to seasonal cycles and long-term trends have been removed to highlight sea level anomalies associated with El Niño and other short-term natural phenomena.
Earlier in spring 2026, the satellite started to detect precursor signs of El Niño as swells of warm water hundreds of miles wide, known as Kelvin waves, moved from the western Pacific to the eastern Pacific. That happens when trade winds in the western equatorial Pacific weaken and then temporarily reverse to blow from the west. Warm water piles up in the east, deepening the warm surface layer, lowering the thermocline, and suppressing the upwelling that usually keeps waters along the Pacific coasts of the Americas cooler.
This buildup of heat beneath the water’s surface is what sea surface height observations capture. It goes beyond surface temperature measurements to indicate how much heat is stored in the subsurface. That’s important because a shallow warm layer might not have much impact on climate and weather, while a large reservoir of heat below the surface can matter more.
According to JPL sea level researcher Severine Fournier, deputy project scientist for Sentinel-6 Michael Freilich, conditions in the western Pacific on June 8 looked similar to those from the same time in 1997, a year when an exceptionally strong El Niño emerged. Warm conditions in the eastern Pacific in 2026 have lagged behind, however, with fewer Kelvin waves built up by the same date.
Still, more warm Kelvin waves appeared to be approaching the eastern Pacific, meaning El Niño was still strengthening. Whether it catches up to 1997 depends on ocean activity in the coming weeks. “For now, it looks like it’s going to be a big one—more so than I would have said last week—but we still need more observations to know what’s going to happen.”
NASA Earth Observatory image by Lauren Dauphin, using modified Copernicus Sentinel data (2023) processed by the European Space Agency and further processed by Josh Willis, Severin Fournier, and Kevin Marlis/NASA/JPL-Caltech. Story by Kathryn Hansen.
Some stars have planets. Others are orbited by brown dwarfs, balls of gas too massive to be planets, but too low-mass to be stars. Astronomers love these brown dwarf-star pairs because being paired with a star helps reveal a brown dwarf’s age. Ages of astronomical objects are...
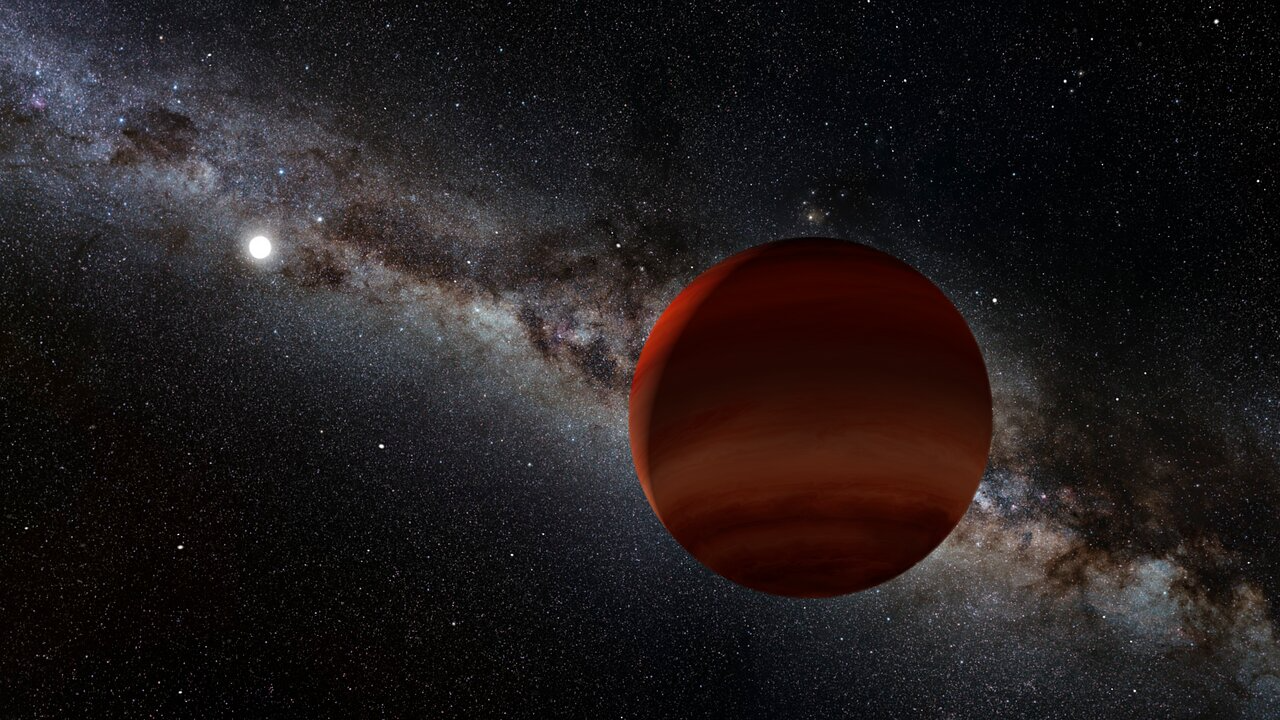
Some stars have planets. Others are orbited by brown dwarfs, balls of gas too massive to be planets, but too low-mass to be stars. Astronomers love these brown dwarf-star pairs because being paired with a star helps reveal a brown dwarf’s age. Ages of astronomical objects are often hard to measure, but essential for understanding how they form.
Now, you can join NASA’s new Backyard Worlds: Binaries project and help astronomers discover these rare and interesting pairs. As a volunteer, you’ll inspect images from NASA’s Wide-field Infrared Survey Explorer (WISE) space telescope. Brown dwarfs may appear as small dots moving across a field of otherwise static stars.
“We need your help to gain critical insights into these enigmatic cosmic objects,” said project lead Aaron Meisner.
Brown dwarfs are common but mysterious because they are so faint. There’s one for every three or four stars in our corner of the Milky Way galaxy. They are important laboratories for understanding giant planets like Jupiter.
Join the Backyard Worlds: Binaries project today and help astronomers understand where and when brown dwarfs form! You can also try one of our other brown dwarf-related projects: Backyard Worlds: Cool Neighbors! Anyone with a laptop or cell phone can participate. Participation does not require citizenship in any particular country.
Artist’s rendering of a brown dwarf orbiting a star.
Credit: NOIRLab/NSF/AURA/P. Marenfeld Acknowledgement: William Pendrill
Some stars have planets. Others are orbited by brown dwarfs, balls of gas too massive to be planets, but too low-mass to be stars. Astronomers love these brown dwarf-star pairs because being paired with a star helps reveal a brown dwarf’s age. Ages of astronomical objects are...
Some stars have planets. Others are orbited by brown dwarfs, balls of gas too massive to be planets, but too low-mass to be stars. Astronomers love these brown dwarf-star pairs because being paired with a star helps reveal a brown dwarf’s age. Ages of astronomical objects are often hard to measure, but essential for understanding how they form.
Now, you can join NASA’s new Backyard Worlds: Binaries project and help astronomers discover these rare and interesting pairs. As a volunteer, you’ll inspect images from NASA’s Wide-field Infrared Survey Explorer (WISE) space telescope. Brown dwarfs may appear as small dots moving across a field of otherwise static stars.
“We need your help to gain critical insights into these enigmatic cosmic objects,” said project lead Aaron Meisner.
Brown dwarfs are common but mysterious because they are so faint. There’s one for every three or four stars in our corner of the Milky Way galaxy. They are important laboratories for understanding giant planets like Jupiter.
Join the Backyard Worlds: Binaries project today and help astronomers understand where and when brown dwarfs form! You can also try one of our other brown dwarf-related projects: Backyard Worlds: Cool Neighbors! Anyone with a laptop or cell phone can participate. Participation does not require citizenship in any particular country.
Artist’s rendering of a brown dwarf orbiting a star.
Credit: NOIRLab/NSF/AURA/P. Marenfeld Acknowledgement: William Pendrill
A new study of two supernova remnants, the debris left behind after stars explode, suggests the explosions came from stellar siblings that once orbited each other. The first star’s detonation sent its binary companion hurtling through space, and then, after traveling for...
6 min read
NASA’s Fermi Mission Uncovers Possible Sibling Supernova Remnants
A new study of two supernova remnants, the debris left behind after stars explode, suggests the explosions came from stellar siblings that once orbited each other. The first star’s detonation sent its binary companion hurtling through space, and then, after traveling for thousands of years, the surviving star blew up too.
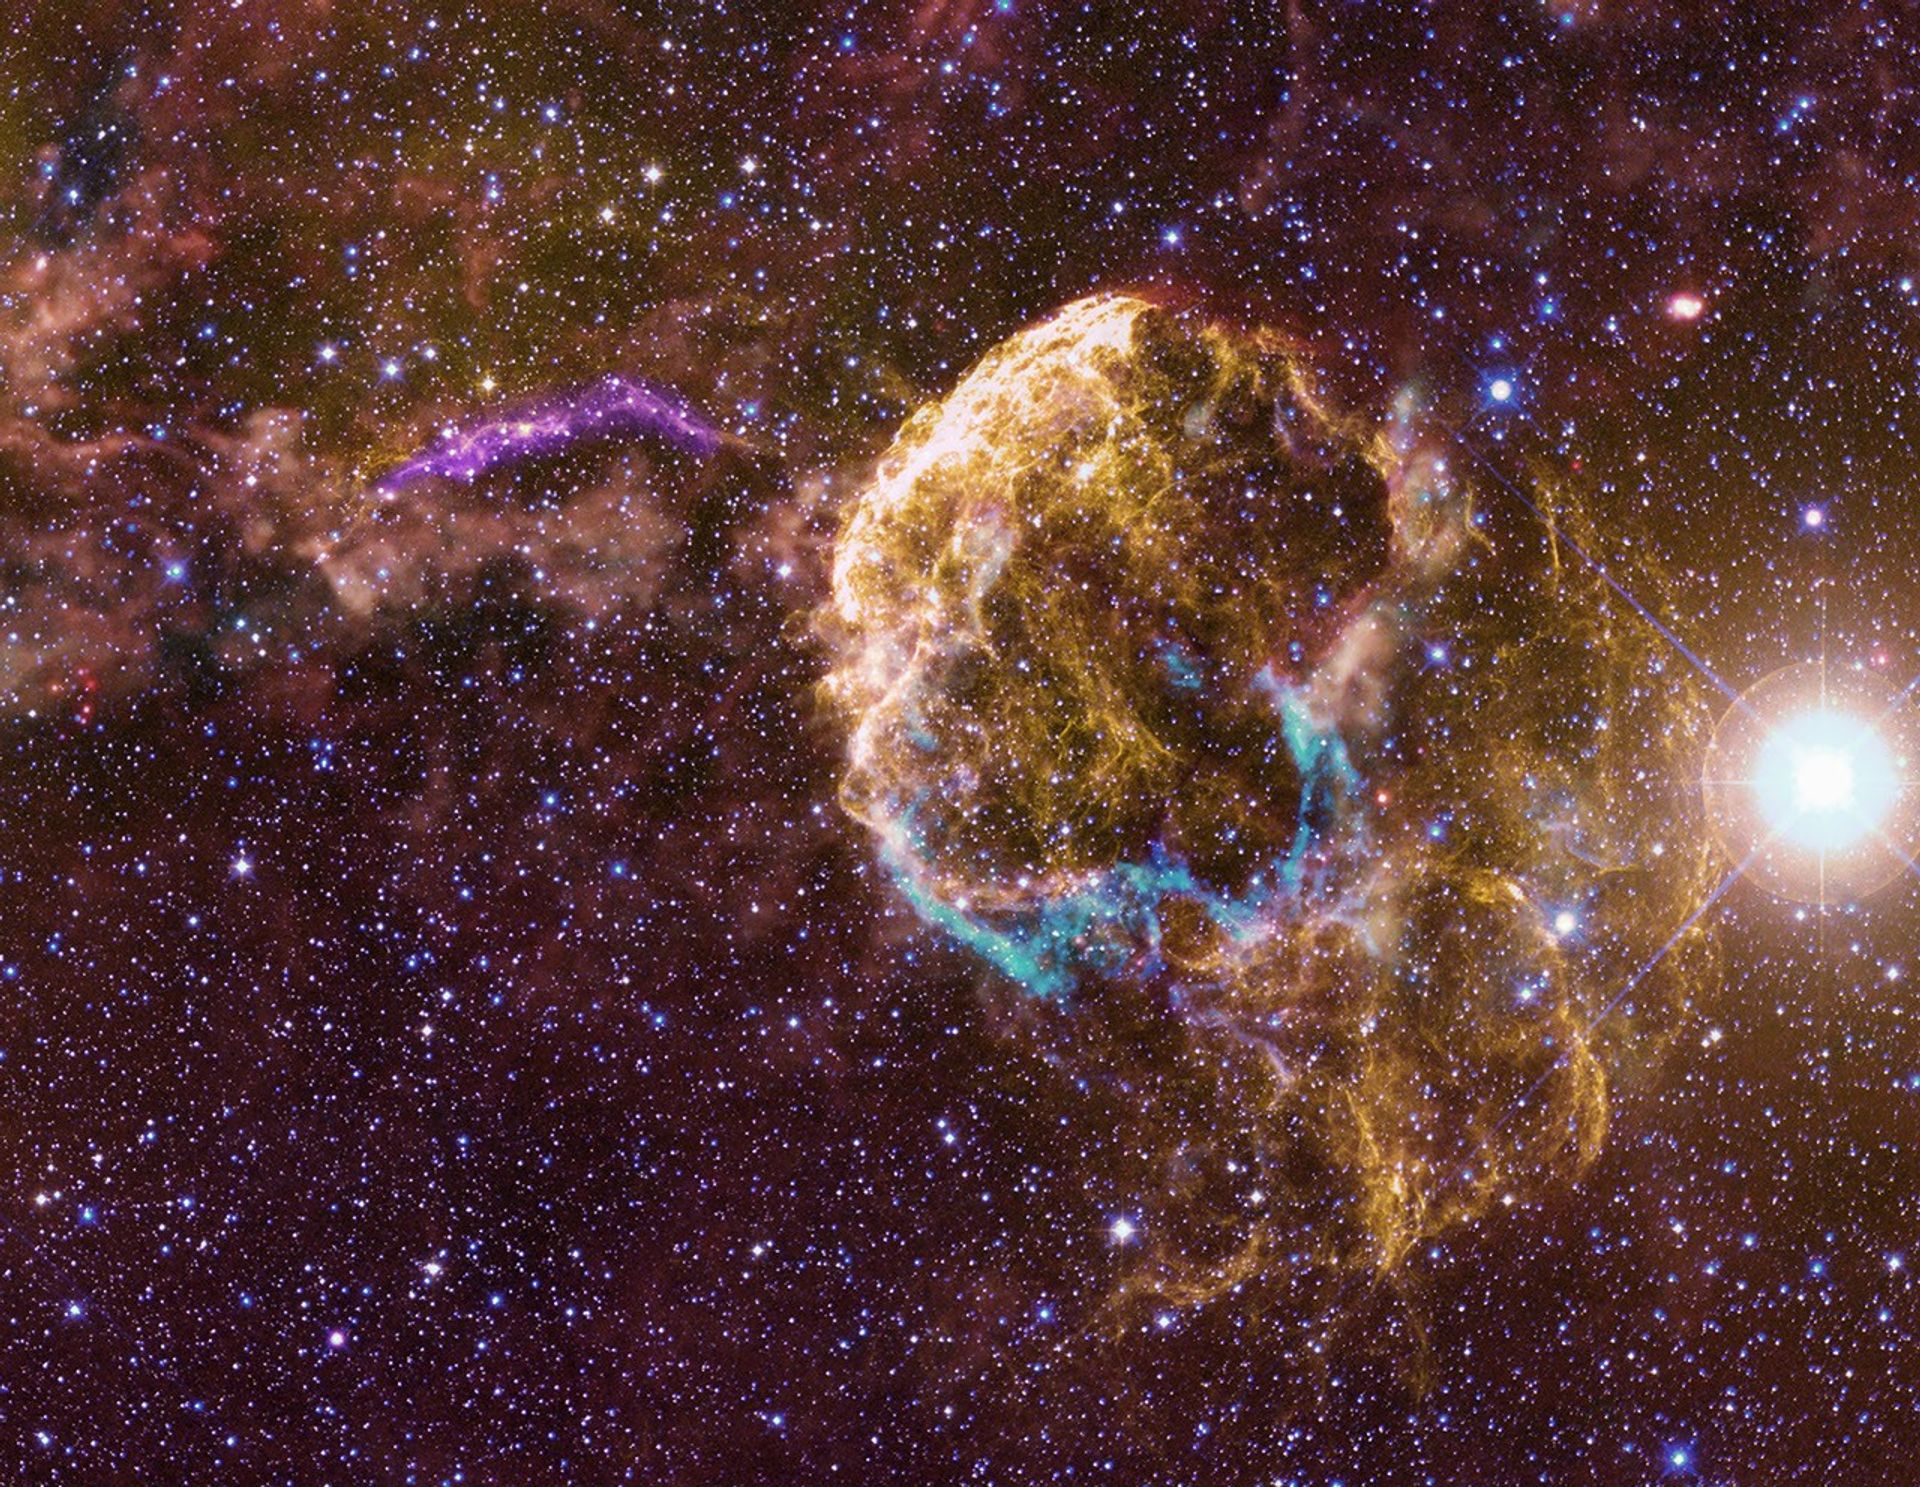
This multiwavelength scene shows the Jellyfish Nebula supernova remnant (right), the interstellar cloud it’s interacting with, and a distinctive curving filament to its upper left. The filament, which is shown here both in optical and ultraviolet (UV) light, is the visible part of an overlapping supernova remnant, G189.6+3.3, that is more prominent in radio and X-rays. Visible light is shown in yellow, UV from NASA’s Neil Gehrels Swift Observatory is shown in violet, and infrared light from NASA’s retired WISE (Wide-field Infrared Survey Explorer) mission appears in cyan, red, and orange. Both remnants are located about 6,000 light-years away in the constellation Gemini. The brilliant star at far right is Propus, also known as Eta Geminorum.
NASA Goddard Space Flight Center and M. Michailidis et al. 2026; optical: DSS; infrared: NASA/WISE/JPL-Caltech/UCLA; ultraviolet: NASA/Swift
“Using 16 years of data from NASA’s Fermi Gamma-ray Space Telescope, our analysis uncovered gamma rays associated with a supernova remnant that was hidden in the glare of its neighbor, the Jellyfish Nebula, one of the brightest gamma-ray-emitting supernova remnants known,” said Miltiadis Michailidis, a postdoctoral fellow in the physics department at Stanford University in California. “There are so many striking connections between the two remnants that we conclude they’re likely related, giving us the first known example of a binary system where both stars have undergone supernova explosions.”
Michailidis presented the findings Wednesday at the 248th meeting of the American Astronomical Society in Pasadena, California. A paper describing the results will appear in a future edition of Nature Communications.
The study focused on a faint supernova remnant called G189.6+3.3, which is mainly visible in X-rays. It is upstaged by its brighter and better-known neighbor, the Jellyfish Nebula (IC 443). The two star wrecks, both located in the constellation Gemini, appear to partially overlap as seen in X-rays. Recent X-ray evidence suggests that hot plasma likely associated with G189.6+3.3 may extend across the entire region, a hint that the overlap may be nearly total.
A massive star explodes when its energy-producing core runs out of fuel and collapses under its own weight, triggering an explosion that blows the star apart. The explosion’s shock wave encloses a hot cloud of debris that rapidly expands into space. So far, astronomers have cataloged about 300 supernova remnants in our galaxy.
The Fermi mission is part of NASA’s fleet of observatories monitoring the changing cosmos to help humanity better understand how the universe works. More than a decade ago, observations from Fermi’s LAT (Large Area Telescope) showed that the shock waves of supernova remnants accelerated particles to within a fraction of the speed of light, a process first proposed by physicist Enrico Fermi — the mission’s namesake — in 1949.
These high-speed particles, called cosmic rays, interact with interstellar gas to produce gamma rays, the highest-energy form of light. Protons make up 99% of cosmic ray particles. To prove that accelerated protons are responsible for the glow, astronomers search for a specific gamma-ray feature. When cosmic-ray protons smash into interstellar gas, they produce a short-lived particle called a neutral pion, which almost immediately decays into a pair of gamma rays. This emission occurs within a specific band of energies associated with the neutral pion’s mass and lies within the range detected by Fermi’s LAT instrument.
In 2013, Fermi observations proved that the Jellyfish Nebula, which is interacting with part of a glowing cloud of hydrogen gas known as Sharpless 249, produced gamma rays through this mechanism. Its neighbor, G189.6+3.3, was discovered in 1994 as part of an X-ray survey by the German-led ROSAT (Roentgen Satellite) mission.
A bright filament of gas lies between the overlapping remnants. New observations of this feature reveal that the shock wave from G189.6+3.3 slammed into dense interstellar gas there and dramatically slowed, key evidence that both remnants are interacting with the same cloud system.
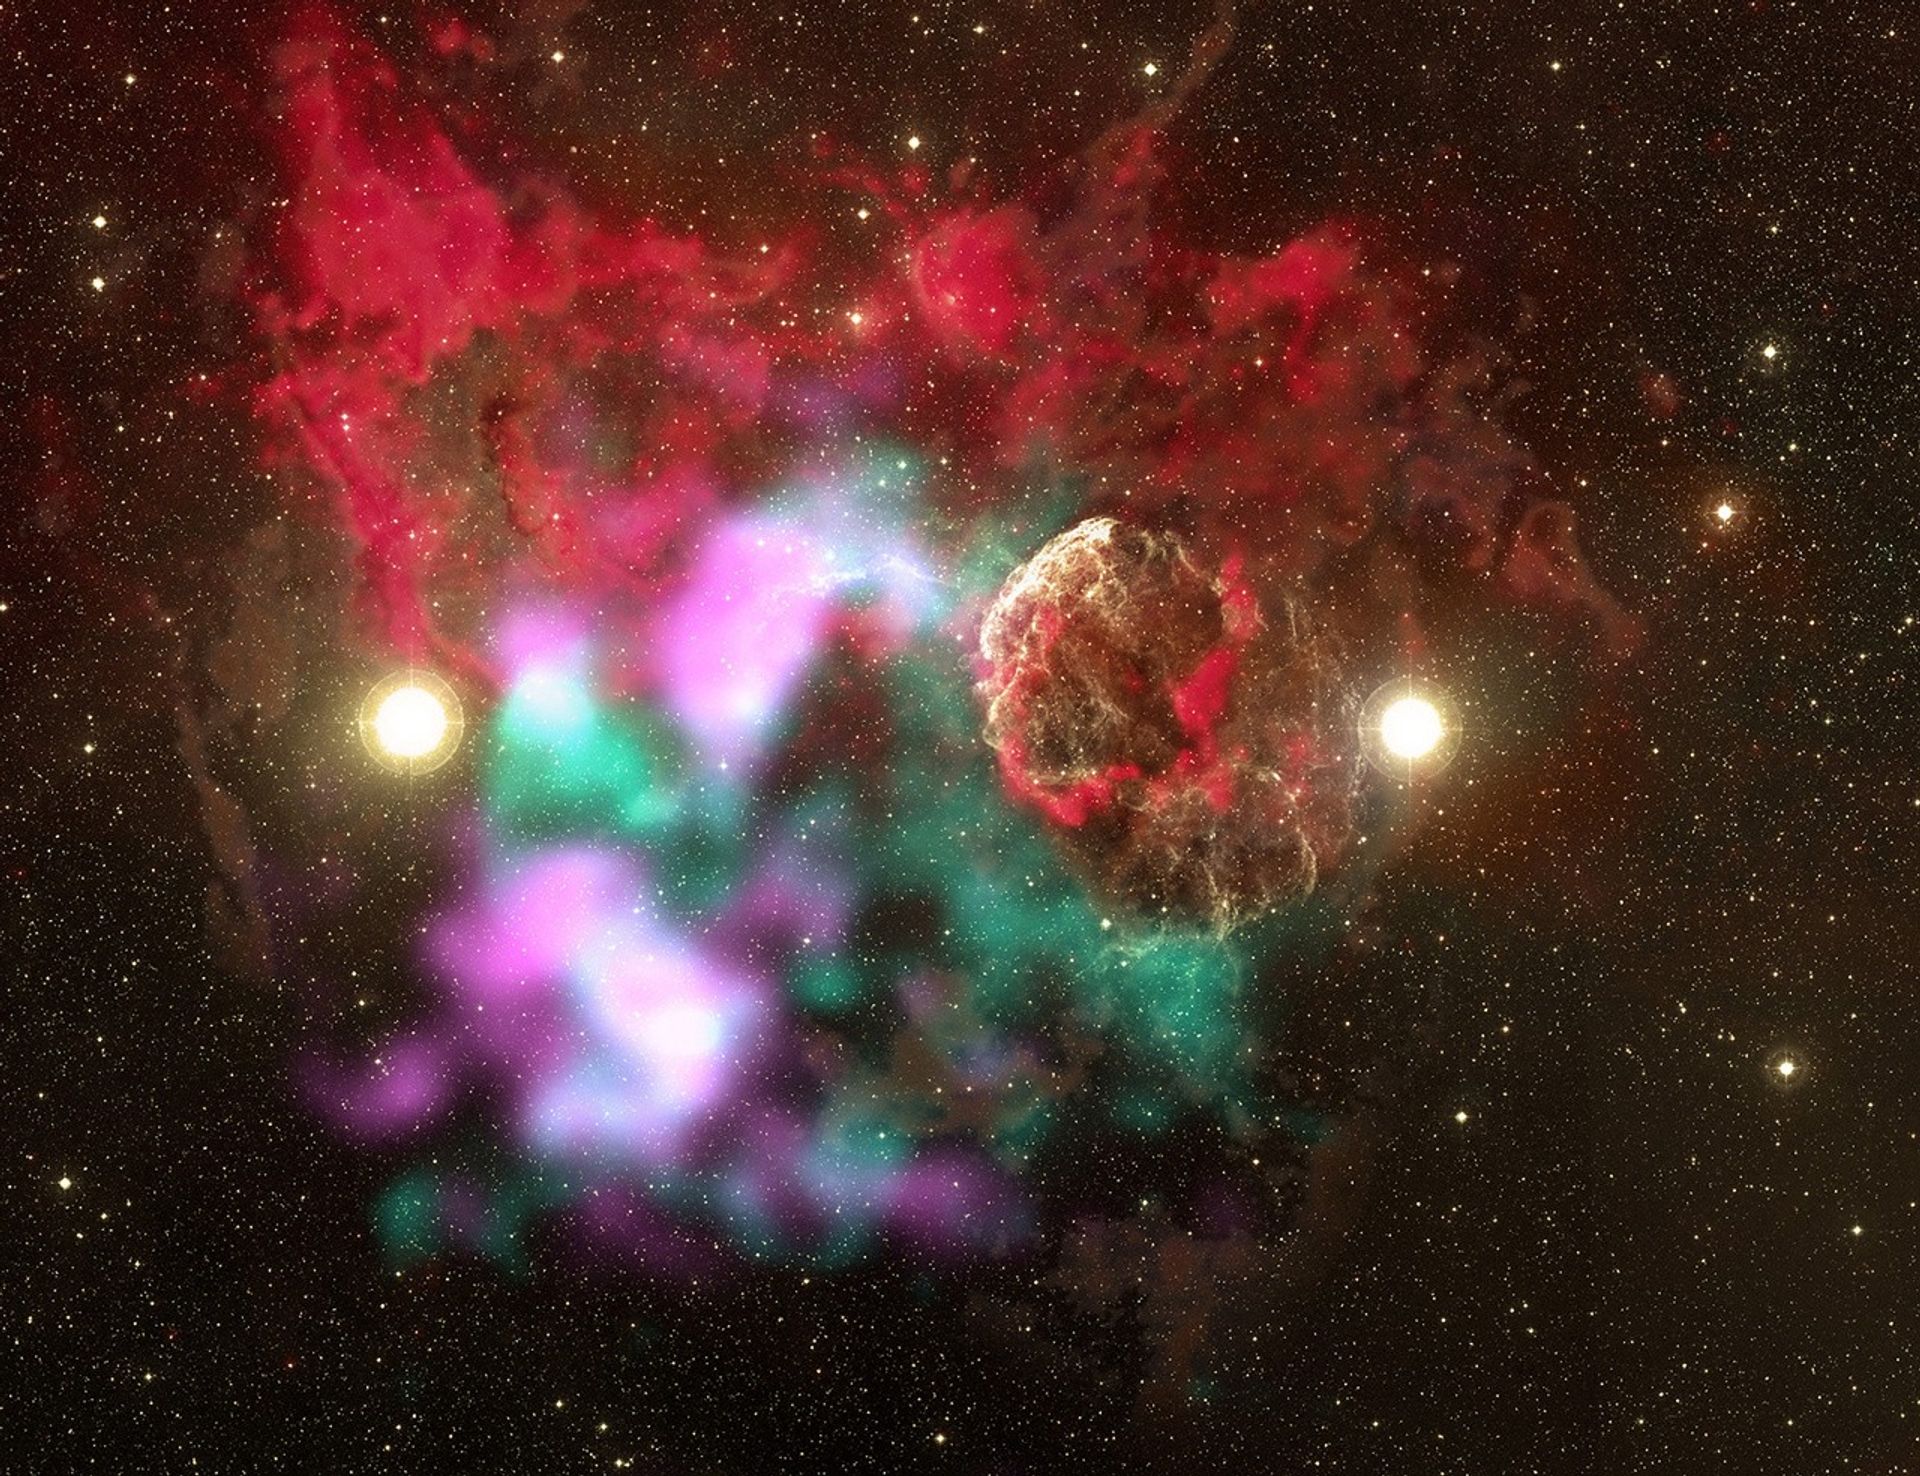
The well-known supernova remnant IC 443 (right) has an older, fainter neighbor (shown here in blue-green and magenta) called G189.6+3.3. A filament of gas between them, glowing in visible and ultraviolet light (violet arc at center), traces the neighbor’s shock wave and shows that both remnants are interacting with the same molecular cloud, shown in red, orange, brown for infrared and radio data and yellow for visible light. Blue-green shows X-rays from the fainter remnant, while magenta shows gamma rays with energies greater than 10 billion electron volts; for comparison, visible light has energies between about 2 and 3 electron volts. In this view, high-energy light from the much brighter IC 443 has been removed for clarity. Gamma-ray emission near the filament stems from protons accelerated in the supernova’s shock wave as it expands into the cloud.
NASA Goddard Space Flight Center and M. Michailidis et al. 2026; radio, MWISP and ESA/Planck; infrared: NASA/WISE/JPL-Caltech/UCLA; optical: DSS; ultraviolet: NASA/Swift; X-ray: SRG/eROSITA; gamma ray: NASA/DOE/Fermi LAT Collaboration
Astronomers think the Jellyfish Nebula is also a candidate PeVatron, a cosmic particle accelerator capable of boosting protons to energies so high they could nearly escape our galaxy. Such particles can produce gamma rays with trillions of times more energy than visible light. Finding a second particle accelerator near the Jellyfish Nebula could offer scientists new clues for how supernova remnants develop into PeVatrons.
“The overlapping remnants, a connecting gas filament, and the availability of data from Fermi and other facilities motivated us to delve into this complex but little-studied region,” said co-author Marianne Lemoine-Goumard, an astrophysicist at the French National Centre for Scientific Research (CNRS) based at the University of Bordeaux. “With Fermi’s LAT instrument, we found gamma-ray emission associated with accelerated protons in the northern part of the fainter remnant. If both remnants are interacting with the same structure, then they must share a common distance from us.”
The team concludes the remnants lie about 6,000 light-years away, their explosion centers are separated by roughly 40 light-years projected onto the plane of the sky, and the original stars may have been 20 or more times the Sun’s mass.
Estimates of the remnants’ ages vary widely, but the team concludes that the age of the Jellyfish Nebula is 8,000 to 9,000 years, while G189.6+3.3 is between 20,000 to 110,000 years old. This means the delay between the explosions could have extended for up to 100,000 years.
In addition, the team conducted computer simulations of a million massive binary systems. They show that systems where the stars orbit close enough to exchange matter and interact during their lives can readily produce dual supernova explosions with similar separations and time delays as those found for the remnants. The team also estimated that the chance of randomly encountering this combination of observed spatial alignment and compatible distances to be less than 1%, strongly supporting a physical association.
“The evidence we’ve compiled — including observations across the spectrum, the chemical and physical properties of the remnants, simulations, and more — paints a compelling picture of a dual supernova event,” said Michailidis.
This study identifies a unique possible example of a binary system where both stars exploded as supernovae and left behind separate, detectable supernova remnants. Astronomers think that most massive stars form in binary or multiple-star systems. The Jellyfish Nebula/G189.6+3.3 complex offers astronomers a rare opportunity to study how massive binary stars evolve, exchange matter, explode, and experience velocity changes — called kicks — induced by the supernova blast. It also provides a powerful new laboratory for understanding how coupled supernova remnants behave, including how they accelerate particles, generate gamma rays, and shape their surrounding environments.
“Fermi’s gamma-ray observations of supernova remnants continue to reveal the dynamic lives of stars,” said Elizabeth Hays, the Fermi project scientist at NASA’s Goddard Space Flight Center in Greenbelt, Maryland. “We can now connect the glowing remains of two massive stars to a powerful pair that evolved together over thousands of years.”
A new study of two supernova remnants, the debris left behind after stars explode, suggests the explosions came from stellar siblings that once orbited each other. The first star’s detonation sent its binary companion hurtling through space, and then, after traveling for...
6 min read
NASA’s Fermi Mission Uncovers Possible Sibling Supernova Remnants
A new study of two supernova remnants, the debris left behind after stars explode, suggests the explosions came from stellar siblings that once orbited each other. The first star’s detonation sent its binary companion hurtling through space, and then, after traveling for thousands of years, the surviving star blew up too.
This multiwavelength scene shows the Jellyfish Nebula supernova remnant (right), the interstellar cloud it’s interacting with, and a distinctive curving filament to its upper left. The filament, which is shown here both in optical and ultraviolet (UV) light, is the visible part of an overlapping supernova remnant, G189.6+3.3, that is more prominent in radio and X-rays. Visible light is shown in yellow, UV from NASA’s Neil Gehrels Swift Observatory is shown in violet, and infrared light from NASA’s retired WISE (Wide-field Infrared Survey Explorer) mission appears in cyan, red, and orange. Both remnants are located about 6,000 light-years away in the constellation Gemini. The brilliant star at far right is Propus, also known as Eta Geminorum.
NASA Goddard Space Flight Center and M. Michailidis et al. 2026; optical: DSS; infrared: NASA/WISE/JPL-Caltech/UCLA; ultraviolet: NASA/Swift
“Using 16 years of data from NASA’s Fermi Gamma-ray Space Telescope, our analysis uncovered gamma rays associated with a supernova remnant that was hidden in the glare of its neighbor, the Jellyfish Nebula, one of the brightest gamma-ray-emitting supernova remnants known,” said Miltiadis Michailidis, a postdoctoral fellow in the physics department at Stanford University in California. “There are so many striking connections between the two remnants that we conclude they’re likely related, giving us the first known example of a binary system where both stars have undergone supernova explosions.”
Michailidis presented the findings Wednesday at the 248th meeting of the American Astronomical Society in Pasadena, California. A paper describing the results will appear in a future edition of Nature Communications.
The study focused on a faint supernova remnant called G189.6+3.3, which is mainly visible in X-rays. It is upstaged by its brighter and better-known neighbor, the Jellyfish Nebula (IC 443). The two star wrecks, both located in the constellation Gemini, appear to partially overlap as seen in X-rays. Recent X-ray evidence suggests that hot plasma likely associated with G189.6+3.3 may extend across the entire region, a hint that the overlap may be nearly total.
A massive star explodes when its energy-producing core runs out of fuel and collapses under its own weight, triggering an explosion that blows the star apart. The explosion’s shock wave encloses a hot cloud of debris that rapidly expands into space. So far, astronomers have cataloged about 300 supernova remnants in our galaxy.
The Fermi mission is part of NASA’s fleet of observatories monitoring the changing cosmos to help humanity better understand how the universe works. More than a decade ago, observations from Fermi’s LAT (Large Area Telescope) showed that the shock waves of supernova remnants accelerated particles to within a fraction of the speed of light, a process first proposed by physicist Enrico Fermi — the mission’s namesake — in 1949.
These high-speed particles, called cosmic rays, interact with interstellar gas to produce gamma rays, the highest-energy form of light. Protons make up 99% of cosmic ray particles. To prove that accelerated protons are responsible for the glow, astronomers search for a specific gamma-ray feature. When cosmic-ray protons smash into interstellar gas, they produce a short-lived particle called a neutral pion, which almost immediately decays into a pair of gamma rays. This emission occurs within a specific band of energies associated with the neutral pion’s mass and lies within the range detected by Fermi’s LAT instrument.
In 2013, Fermi observations proved that the Jellyfish Nebula, which is interacting with part of a glowing cloud of hydrogen gas known as Sharpless 249, produced gamma rays through this mechanism. Its neighbor, G189.6+3.3, was discovered in 1994 as part of an X-ray survey by the German-led ROSAT (Roentgen Satellite) mission.
A bright filament of gas lies between the overlapping remnants. New observations of this feature reveal that the shock wave from G189.6+3.3 slammed into dense interstellar gas there and dramatically slowed, key evidence that both remnants are interacting with the same cloud system.
The well-known supernova remnant IC 443 (right) has an older, fainter neighbor (shown here in blue-green and magenta) called G189.6+3.3. A filament of gas between them, glowing in visible and ultraviolet light (violet arc at center), traces the neighbor’s shock wave and shows that both remnants are interacting with the same molecular cloud, shown in red, orange, brown for infrared and radio data and yellow for visible light. Blue-green shows X-rays from the fainter remnant, while magenta shows gamma rays with energies greater than 10 billion electron volts; for comparison, visible light has energies between about 2 and 3 electron volts. In this view, high-energy light from the much brighter IC 443 has been removed for clarity. Gamma-ray emission near the filament stems from protons accelerated in the supernova’s shock wave as it expands into the cloud.
NASA Goddard Space Flight Center and M. Michailidis et al. 2026; radio, MWISP and ESA/Planck; infrared: NASA/WISE/JPL-Caltech/UCLA; optical: DSS; ultraviolet: NASA/Swift; X-ray: SRG/eROSITA; gamma ray: NASA/DOE/Fermi LAT Collaboration
Astronomers think the Jellyfish Nebula is also a candidate PeVatron, a cosmic particle accelerator capable of boosting protons to energies so high they could nearly escape our galaxy. Such particles can produce gamma rays with trillions of times more energy than visible light. Finding a second particle accelerator near the Jellyfish Nebula could offer scientists new clues for how supernova remnants develop into PeVatrons.
“The overlapping remnants, a connecting gas filament, and the availability of data from Fermi and other facilities motivated us to delve into this complex but little-studied region,” said co-author Marianne Lemoine-Goumard, an astrophysicist at the French National Centre for Scientific Research (CNRS) based at the University of Bordeaux. “With Fermi’s LAT instrument, we found gamma-ray emission associated with accelerated protons in the northern part of the fainter remnant. If both remnants are interacting with the same structure, then they must share a common distance from us.”
The team concludes the remnants lie about 6,000 light-years away, their explosion centers are separated by roughly 40 light-years projected onto the plane of the sky, and the original stars may have been 20 or more times the Sun’s mass.
Estimates of the remnants’ ages vary widely, but the team concludes that the age of the Jellyfish Nebula is 8,000 to 9,000 years, while G189.6+3.3 is between 20,000 to 110,000 years old. This means the delay between the explosions could have extended for up to 100,000 years.
In addition, the team conducted computer simulations of a million massive binary systems. They show that systems where the stars orbit close enough to exchange matter and interact during their lives can readily produce dual supernova explosions with similar separations and time delays as those found for the remnants. The team also estimated that the chance of randomly encountering this combination of observed spatial alignment and compatible distances to be less than 1%, strongly supporting a physical association.
“The evidence we’ve compiled — including observations across the spectrum, the chemical and physical properties of the remnants, simulations, and more — paints a compelling picture of a dual supernova event,” said Michailidis.
This study identifies a unique possible example of a binary system where both stars exploded as supernovae and left behind separate, detectable supernova remnants. Astronomers think that most massive stars form in binary or multiple-star systems. The Jellyfish Nebula/G189.6+3.3 complex offers astronomers a rare opportunity to study how massive binary stars evolve, exchange matter, explode, and experience velocity changes — called kicks — induced by the supernova blast. It also provides a powerful new laboratory for understanding how coupled supernova remnants behave, including how they accelerate particles, generate gamma rays, and shape their surrounding environments.
“Fermi’s gamma-ray observations of supernova remnants continue to reveal the dynamic lives of stars,” said Elizabeth Hays, the Fermi project scientist at NASA’s Goddard Space Flight Center in Greenbelt, Maryland. “We can now connect the glowing remains of two massive stars to a powerful pair that evolved together over thousands of years.”
Drought and water releases drained the Arizona reservoir to levels that have led to widespread fish deaths.
June 7, 2023
May 22, 2026
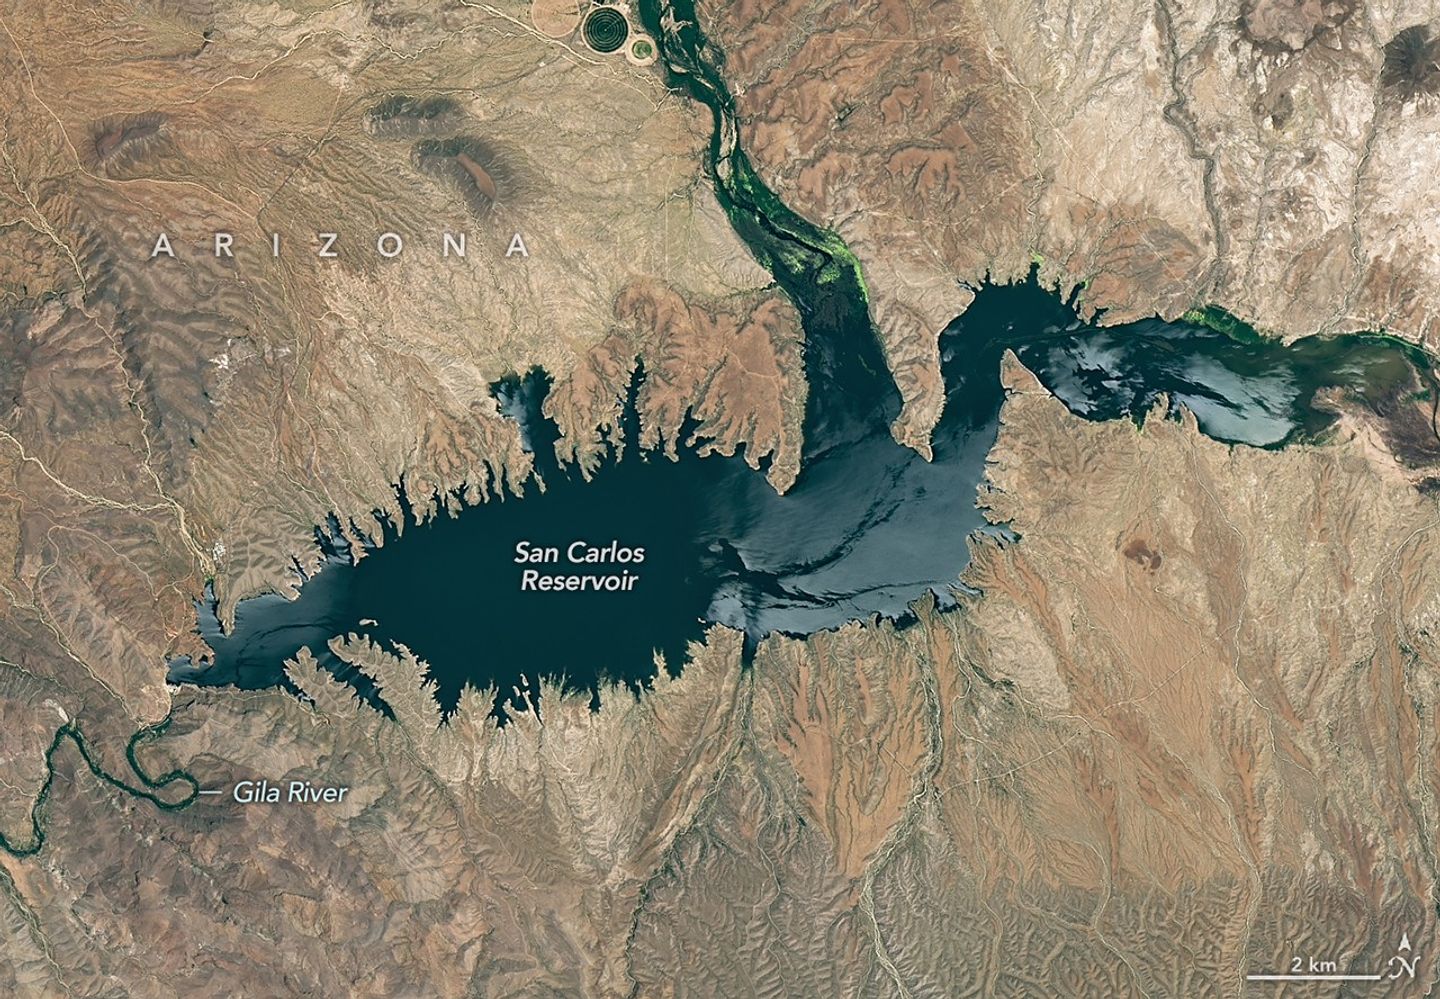
The reservoir appears lake-like and expansive in an image acquired in June 2023.
NASA Earth Observatory/Michala Garrison
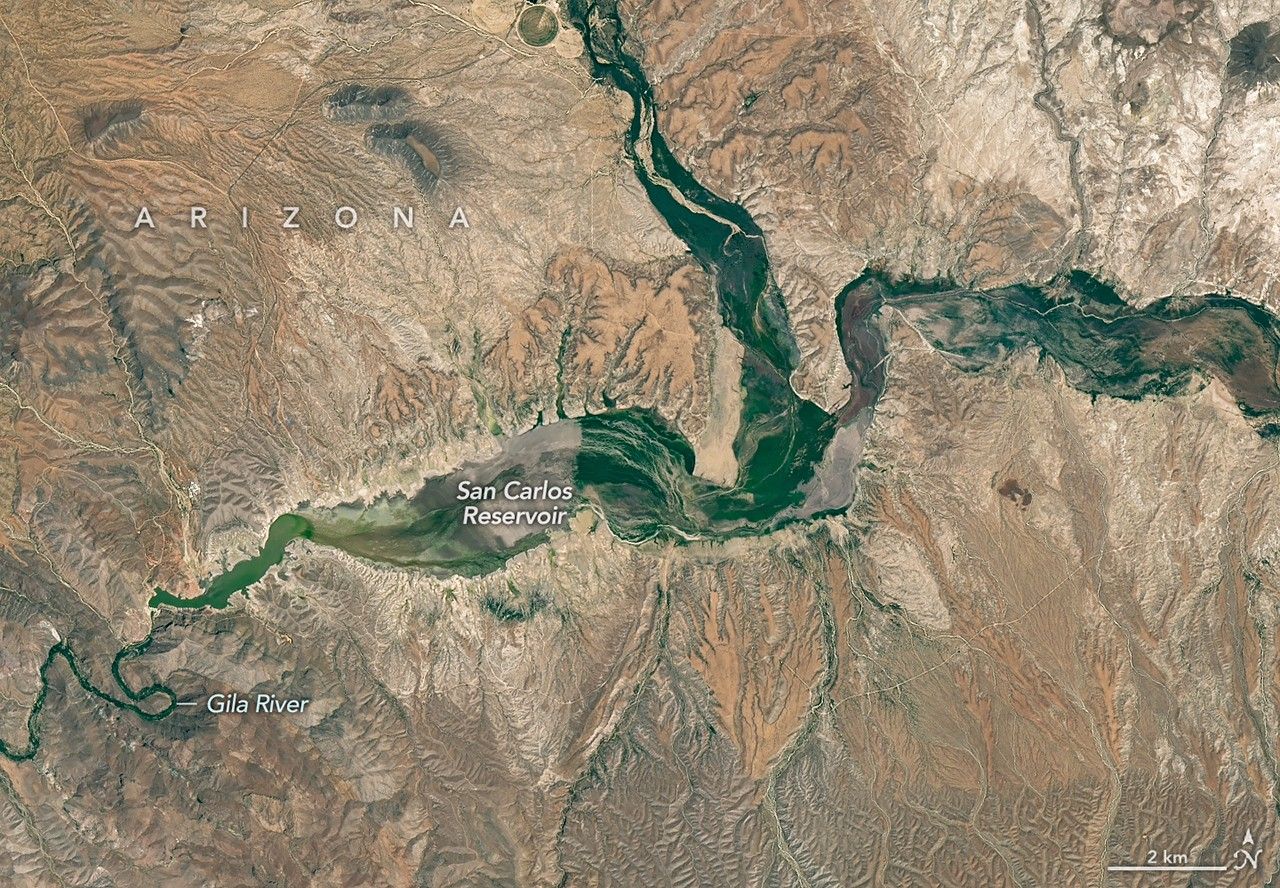
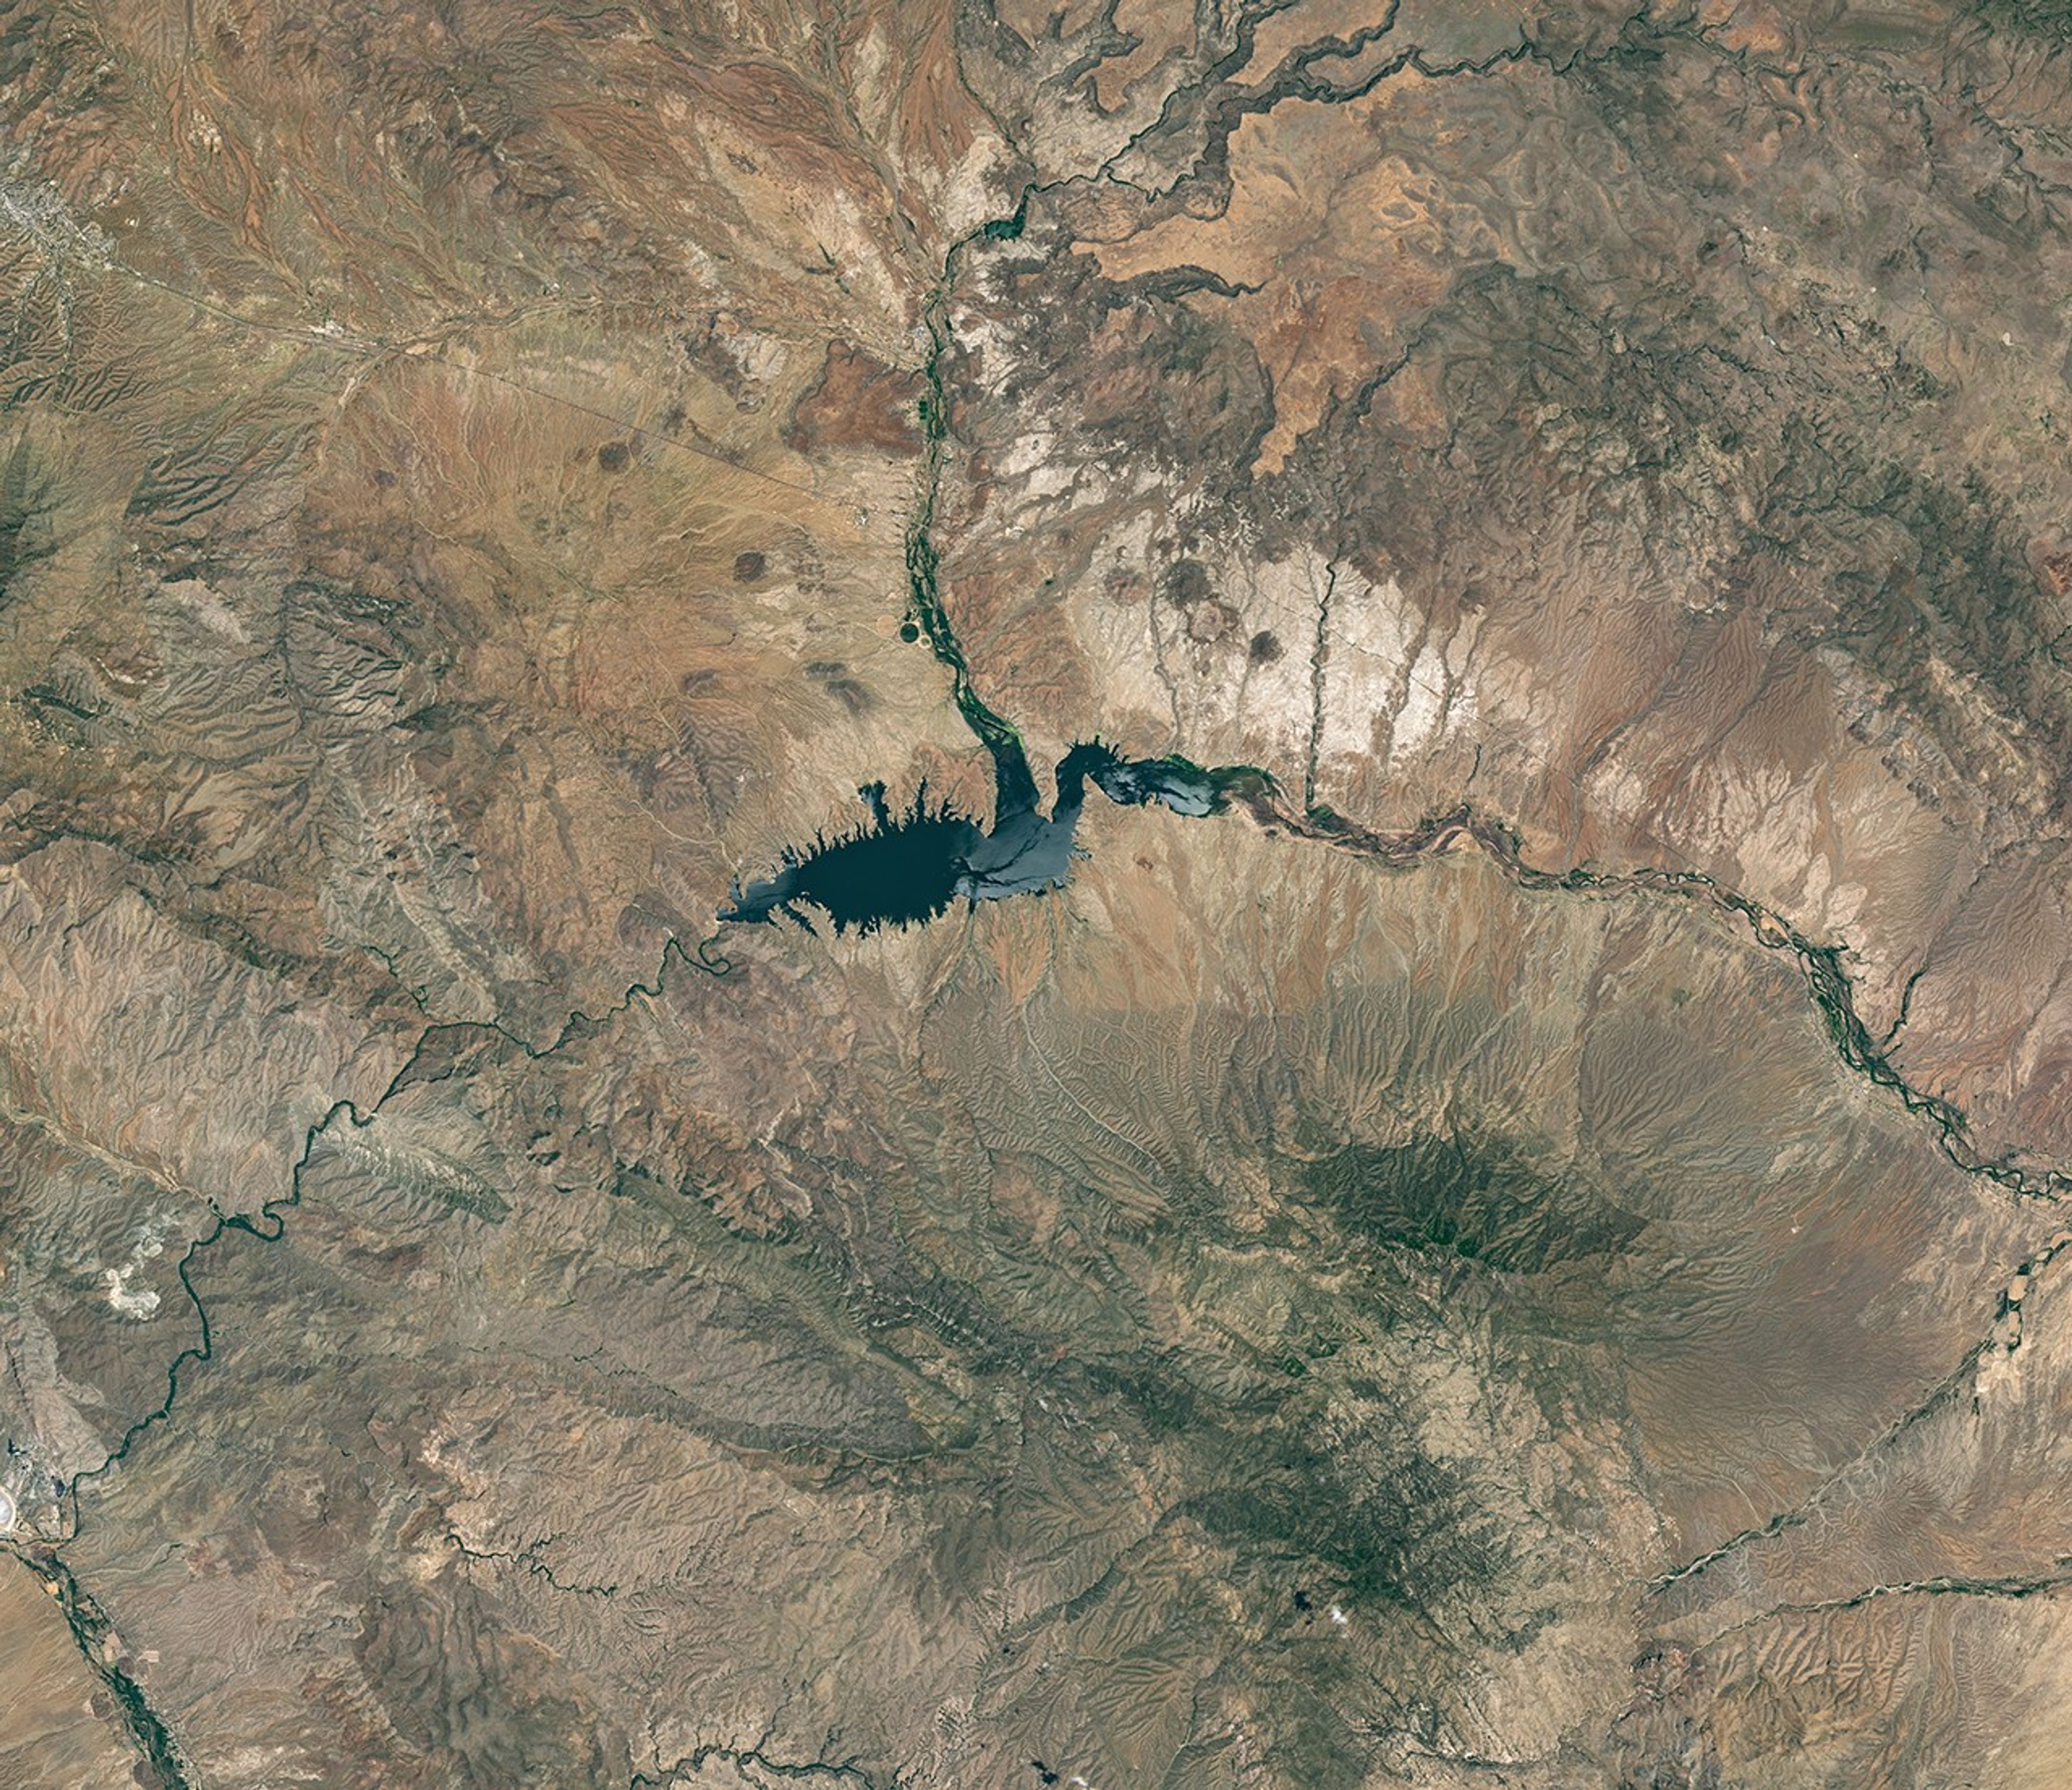
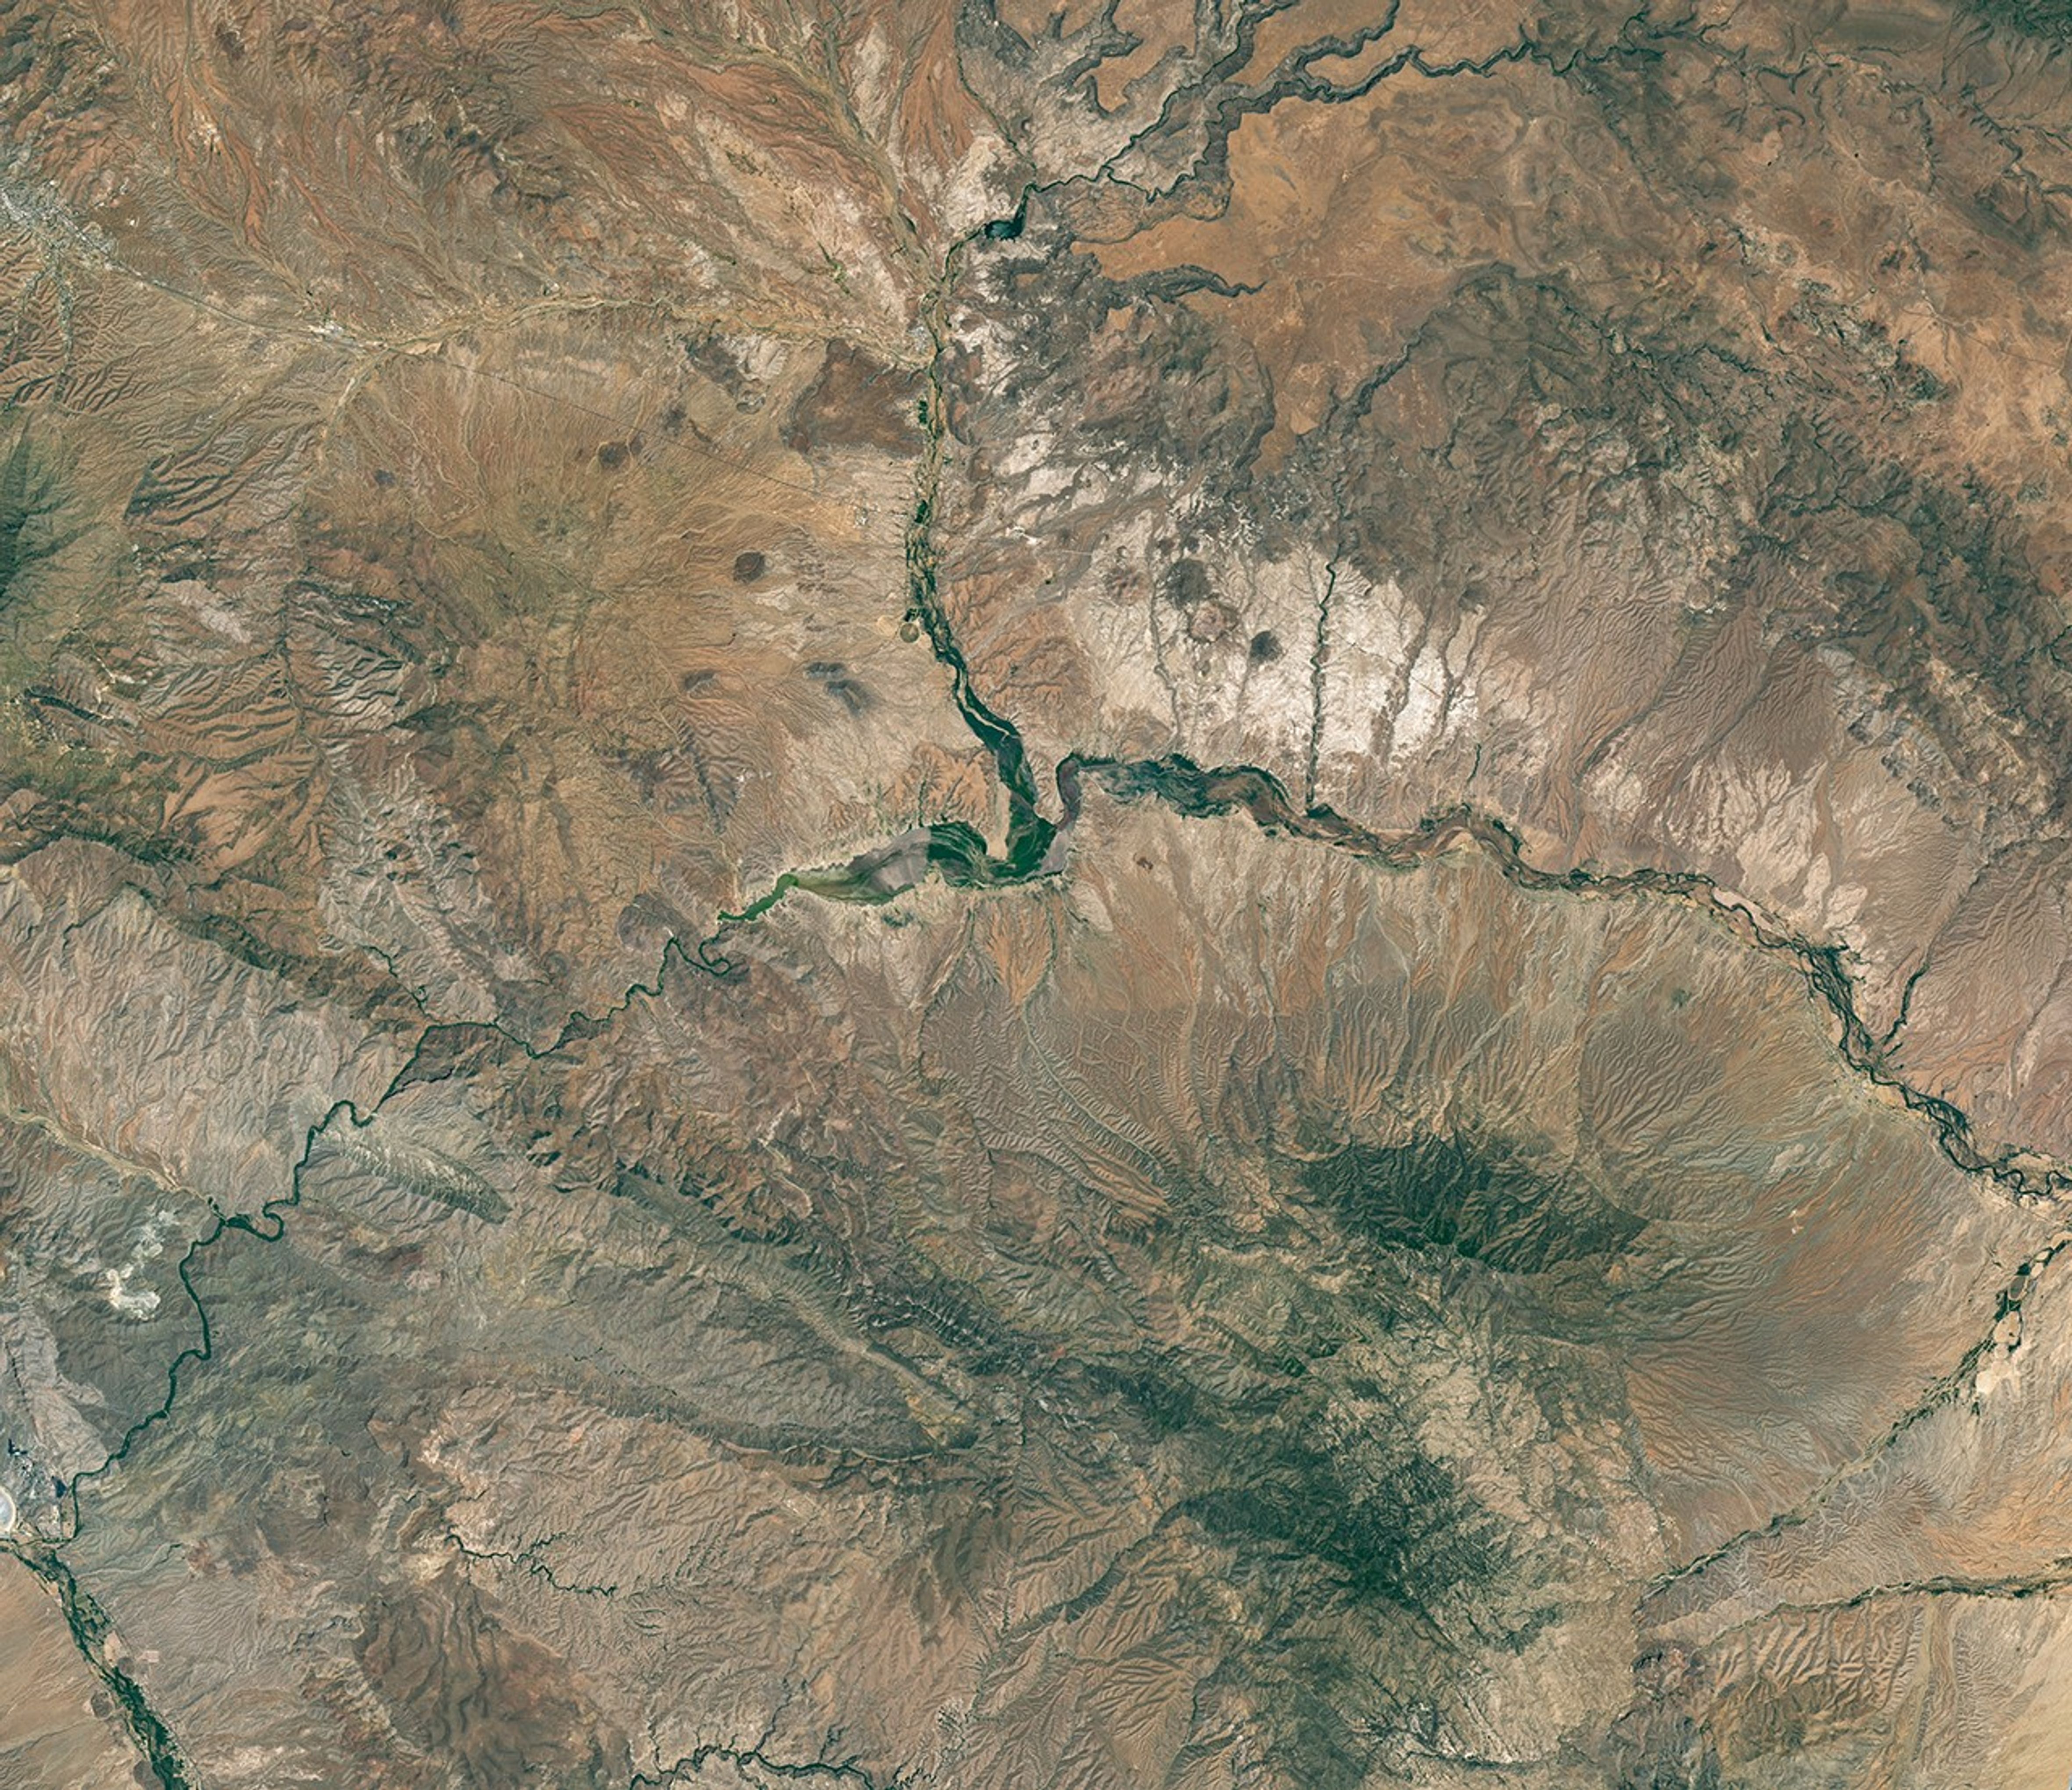
The reservoir is nearly empty by May 2026. The Gila River’s natural channel is now visible and flanked with green vegetation in what had been the bottom of the reservoir.
NASA Earth Observatory/Michala Garrison
The reservoir appears lake-like and expansive in an image acquired in June 2023.
NASA Earth Observatory/Michala Garrison
The reservoir is nearly empty by May 2026. The Gila River’s natural channel is now visible and flanked with green vegetation in what had been the bottom of the reservoir.
NASA Earth Observatory/Michala Garrison
June 7, 2023
May 22, 2026
Little water remains in the San Carlos Reservoir in May 2026 (right) compared to fuller conditions in June 2023 (left). Images were captured by the OLI (Operational Land Imager) on the Landsat 9 and 8 satellites, respectively. NASA Earth Observatory images by Michala Garrison.
The Gila River is among the Southwest’s most important rivers, delivering water for people, farms, and wildlife while linking the snow-fed mountains of southwestern New Mexico to the desert lowlands of southwestern Arizona.
In wetter years, seasonal snowfall on the Mogollon Mountains and Black Range provides much of the river’s spring flow and helps refill San Carlos Reservoir, which is formed by the Coolidge Dam. When filled to capacity, the reservoir is one of Arizona’s largest bodies of water.
However, in 2026, lackluster snowfall left the mountain snowpack in the Gila River watershed at 2 percent of the 1991-2020 March median. The limited snowpack pushed April streamflow to 39 percent of normal. By June, after mandatory water releases for downstream agriculture, the reservoir held less than 400 acre-feet of water.
The Landsat image above (right) shows the near-empty reservoir on May 22, 2026, when it stored 389 acre-feet of water—less than 1 percent full; the other image (left) shows the same area in June 2023, when it was about 60 percent full. The green vegetation growing along the river channel and reservoir edge includes a mixture of tamarisk, willow, cottonwood, sedges, and grasses.
Officials closed the reservoir indefinitely on June 5, 2026, after the declining water levels contributed to low oxygen levels—hypoxia—that killed virtually all of its fish. Species living in the reservoir included largemouth bass, black crappie, bluegill, channel catfish, flathead catfish, and several stocked species, including brown trout and rainbow trout. The decomposing fish may pose health risks to people attempting to boat or fish, the San Carlos Recreation and Wildlife Department warned.
The reservoir has hit similarly low water levels in the past, running out of water at least 20 times since it was filled in 1930, according to news reports. Even when the dam and reservoir were first dedicated, there was enough grass growing on the dried reservoir bottom that humorist Will Rogers famously quipped to President Calvin Coolidge: “If that was my lake, I’d mow it.”
Other years with major fish kills include 1976 and 2018. After more than 5 million fish died during a similar event in 1976, the Gila Heraldreported that it took five years for the lake’s ecosystem to rebound.
The region is currently in the midst of a multi-year dry period that has left much of the Gila River’s headwaters in New Mexico in a state of severe drought, according to data from the U.S. Drought Monitor.
However, the river’s flow is highly variable, and heavy rains during the coming wet season could help the reservoir recover. A seasonal monsoon outlook released by NOAA in May 2026 projected a 33 to 50 percent chance that an above-average amount of rain would fall in the region that summer. El Niño in the central and eastern equatorial Pacific, which was strengthening in late spring 2026, can make heavy rains in the U.S. Southwest more likely.
NASA Earth Observatory images by Michala Garrison, using Landsat data from the U.S. Geological Survey.Story by Adam Voiland.
Drought and water releases drained the Arizona reservoir to levels that have led to widespread fish deaths.
June 7, 2023
May 22, 2026
The reservoir appears lake-like and expansive in an image acquired in June 2023.
NASA Earth Observatory/Michala Garrison
The reservoir is nearly empty by May 2026. The Gila River’s natural channel is now visible and flanked with green vegetation in what had been the bottom of the reservoir.
NASA Earth Observatory/Michala Garrison
June 7, 2023
May 22, 2026
Little water remains in the San Carlos Reservoir in May 2026 (right) compared to fuller conditions in June 2023 (left). Images were captured by the OLI (Operational Land Imager) on the Landsat 9 and 8 satellites, respectively. NASA Earth Observatory images by Michala Garrison.
The Gila River is among the Southwest’s most important rivers, delivering water for people, farms, and wildlife while linking the snow-fed mountains of southwestern New Mexico to the desert lowlands of southwestern Arizona.
In wetter years, seasonal snowfall on the Mogollon Mountains and Black Range provides much of the river’s spring flow and helps refill San Carlos Reservoir, which is formed by the Coolidge Dam. When filled to capacity, the reservoir is one of Arizona’s largest bodies of water.
However, in 2026, lackluster snowfall left the mountain snowpack in the Gila River watershed at 2 percent of the 1991-2020 March median. The limited snowpack pushed April streamflow to 39 percent of normal. By June, after mandatory water releases for downstream agriculture, the reservoir held less than 400 acre-feet of water.
The Landsat image above (right) shows the near-empty reservoir on May 22, 2026, when it stored 389 acre-feet of water—less than 1 percent full; the other image (left) shows the same area in June 2023, when it was about 60 percent full. The green vegetation growing along the river channel and reservoir edge includes a mixture of tamarisk, willow, cottonwood, sedges, and grasses.
Officials closed the reservoir indefinitely on June 5, 2026, after the declining water levels contributed to low oxygen levels—hypoxia—that killed virtually all of its fish. Species living in the reservoir included largemouth bass, black crappie, bluegill, channel catfish, flathead catfish, and several stocked species, including brown trout and rainbow trout. The decomposing fish may pose health risks to people attempting to boat or fish, the San Carlos Recreation and Wildlife Department warned.
The reservoir has hit similarly low water levels in the past, running out of water at least 20 times since it was filled in 1930, according to news reports. Even when the dam and reservoir were first dedicated, there was enough grass growing on the dried reservoir bottom that humorist Will Rogers famously quipped to President Calvin Coolidge: “If that was my lake, I’d mow it.”
Other years with major fish kills include 1976 and 2018. After more than 5 million fish died during a similar event in 1976, the Gila Heraldreported that it took five years for the lake’s ecosystem to rebound.
The region is currently in the midst of a multi-year dry period that has left much of the Gila River’s headwaters in New Mexico in a state of severe drought, according to data from the U.S. Drought Monitor.
However, the river’s flow is highly variable, and heavy rains during the coming wet season could help the reservoir recover. A seasonal monsoon outlook released by NOAA in May 2026 projected a 33 to 50 percent chance that an above-average amount of rain would fall in the region that summer. El Niño in the central and eastern equatorial Pacific, which was strengthening in late spring 2026, can make heavy rains in the U.S. Southwest more likely.
NASA Earth Observatory images by Michala Garrison, using Landsat data from the U.S. Geological Survey.Story by Adam Voiland.
That’s the latest from researchers analyzing NASA’s James Webb Space Telescope’s observations of HD 80606 b, an exoplanet four times the mass of Jupiter with an extremely elliptical orbit that sweeps close by its Sun-like star.
4 Min Read
NASA’s Webb Catches Exoplanet Getting Roasted
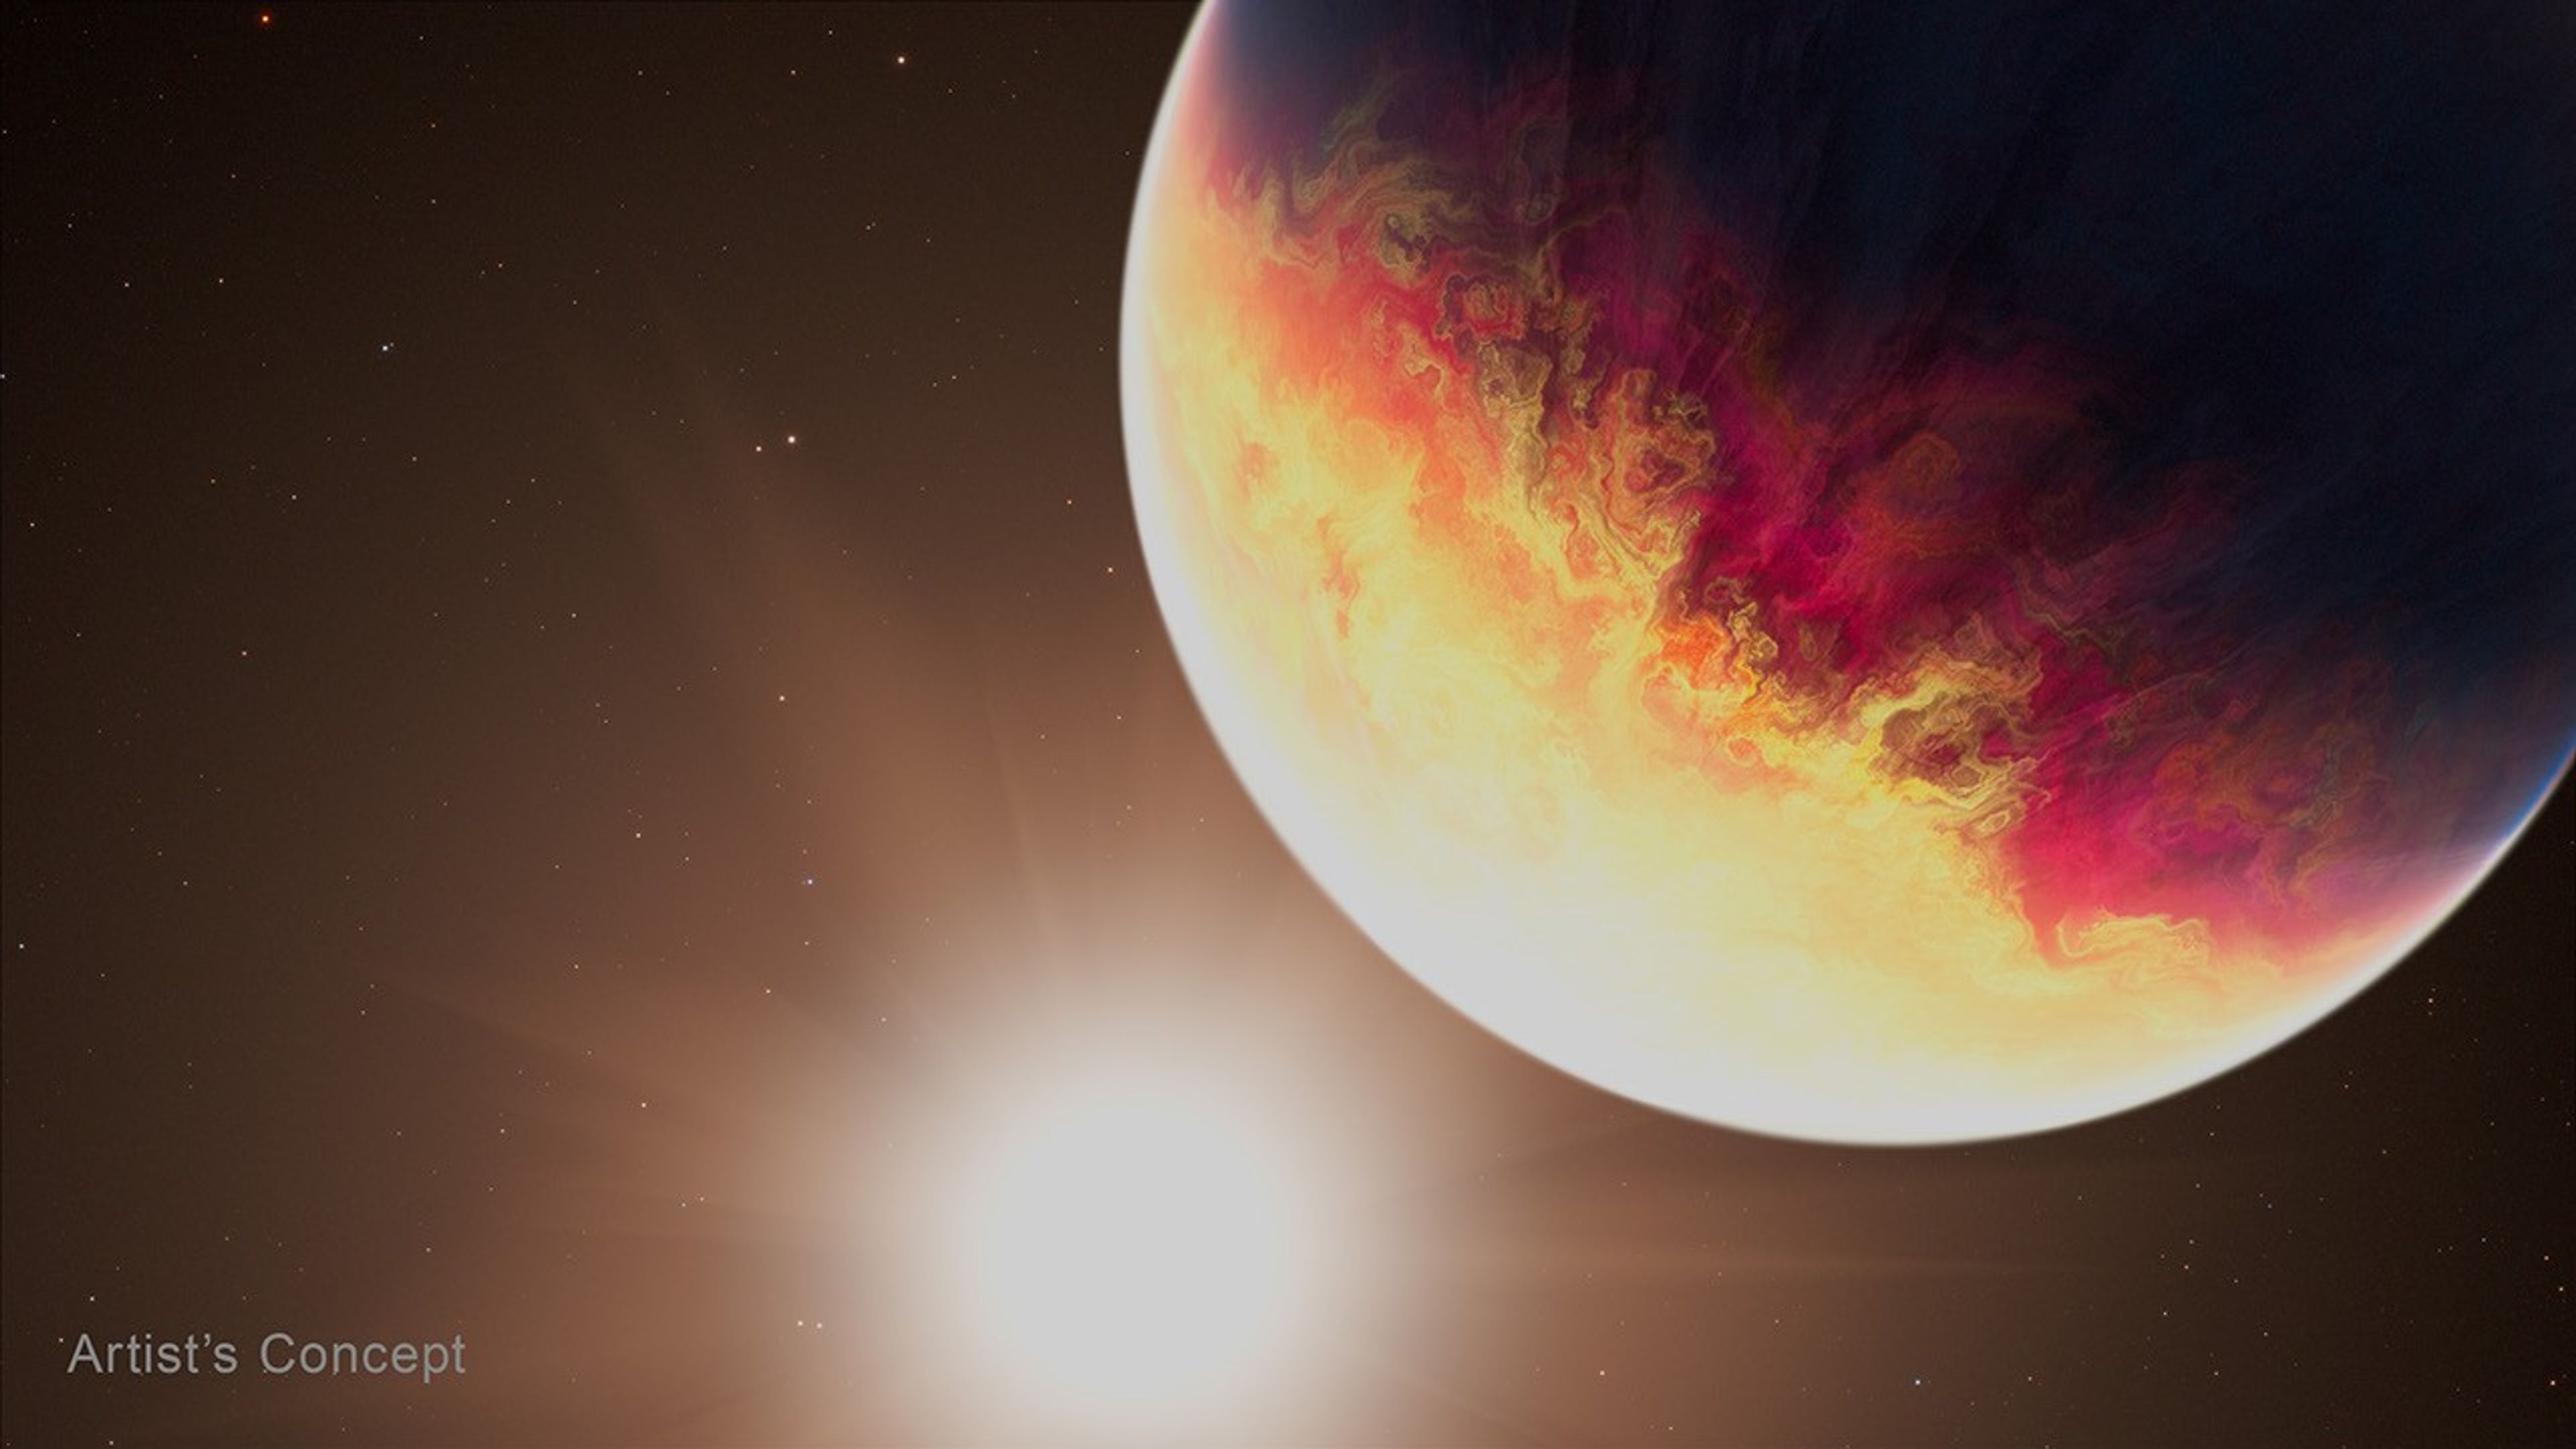
This artist’s concept shows exoplanet HD 80606 b being “roasted” as its orbit approaches periastron, the point at which it is closest to its host star, which is similar to our Sun.
Credits: Artwork: NASA, ESA, CSA, Joseph Olmsted (STScI)
4 min read
NASA’s Webb Catches Exoplanet Getting Roasted
One well-done gas giant, coming right up! That’s the latest from researchers analyzing NASA’s James Webb Space Telescope’s observations of HD 80606 b, an exoplanet four times the mass of Jupiter with an extremely elliptical orbit that sweeps close by its Sun-like star. The research team is presenting their study and preliminary findings Tuesday at the 248th meeting of the American Astronomical Society in Pasadena, California.
“Hot Jupiters are already considered some of the most extreme exoplanets we know of, but even among that population, HD 80606 b is one of the most extreme,” said Tiffany Kataria, the study’s principal investigator at NASA’s Jet Propulsion Laboratory in Southern California. “We typically think of hot Jupiters as hot gas giants sitting right next to their stars, but this planet’s highly eccentric orbit creates a completely different beast.”
As the planet plunges close to its star, Webb shows its temperature skyrockets by 1,100 degrees Fahrenheit. Previous studies have shown that radical temperature swings can cause an exoplanet’s chemistry and clouds to change in real time. According to the research team, the dynamic conditions of HD 80606 b make the planet an ideal target to observe these changes with Webb’s powerful instruments.
Image: Artist’s concept exoplanet HD 80606 b
This artist’s concept shows exoplanet HD 80606 b being “roasted” as its orbit approaches periastron, the point at which it is closest to its host star, which is similar to our Sun.
Artwork: NASA, ESA, CSA, Joseph Olmsted (STScI)
“Observing a planet like HD 80606 b is actually very efficient because its unusual orbit, with the corresponding swings in temperature and chemical composition, allow us to gather data under varying conditions in just hours and apply those findings to other hot Jupiters or more conventional exoplanets,” said Laura C. Mayorga, co-investigator on the study and an exoplanet astronomer at the Johns Hopkins Applied Physics Laboratory in Laurel, Maryland.
Measurements of temperature and chemical composition were done with spectroscopy, a technique scientists use to break light into its component colors to reveal information about the composition, temperature, motion, and physical properties of objects in space. The team used Webb’s MIRI (Mid-Infrared Instrument) for an extended observation of HD 80606 b before, during, and after its periastron, or closest pass by its star. During periastron, the planet also passed behind the star from Webb’s perspective in what’s known as a secondary eclipse. The observation was years in the planning, as scheduling the time to catch the planet at this point was complex given its extremely elliptical 111-day orbit, and Webb’s own restrictions on where it can look during specific times of the year, based on Earth’s position in orbit around the Sun.
Researchers say they have only begun to peel back the layers of an incredibly rich dataset, but they can clearly see a dramatic shift in the exoplanet’s temperature. “Webb has shown that the planet’s increase in temperature was even more extreme than we anticipated based on Spitzer data,” said Kataria.
In fact, the planet had already been dubbed the “roasted exoplanet” and even got its own poster in NASA’s popular series. NASA’s now-retired Spitzer Space Telescope laid the groundwork of infrared observations of HD 80606 b, showing that more detailed spectroscopic data from Webb would be especially compelling.
“Spitzer did amazing work on this exoplanet, and now Webb is building on that legacy by enabling us to drill down to distinguish specific chemical signatures like methane and carbon dioxide, which is just amazing progress,” said Ryan Challener, co-author and research associate at the Cornell Center for Astrophysics and Planetary Science. “There’s so much to learn from this one dataset here — we really are just getting started deciphering what Webb has to tell us.”
The James Webb Space Telescope is the world’s premier space science observatory. Webb is solving mysteries in our solar system, looking beyond to distant worlds around other stars, and probing the mysterious structures and origins of our universe and our place in it. Webb is an international program led by NASA with its partners, ESA (European Space Agency) and CSA (Canadian Space Agency).
The following sections contain links to download this article’s images and videos in all available resolutions followed by related information links, media contacts, and if available, research paper and Spanish translation links.
Related Images & Videos
HD 80606 b (Artist’s Concept)
This artist’s concept shows exoplanet HD 80606 b being “roasted” as its orbit approaches periastron, the point at which it is closest to its host star, which is similar to our Sun.
That’s the latest from researchers analyzing NASA’s James Webb Space Telescope’s observations of HD 80606 b, an exoplanet four times the mass of Jupiter with an extremely elliptical orbit that sweeps close by its Sun-like star.
4 Min Read
NASA’s Webb Catches Exoplanet Getting Roasted
This artist’s concept shows exoplanet HD 80606 b being “roasted” as its orbit approaches periastron, the point at which it is closest to its host star, which is similar to our Sun.
Credits: Artwork: NASA, ESA, CSA, Joseph Olmsted (STScI)
4 min read
NASA’s Webb Catches Exoplanet Getting Roasted
One well-done gas giant, coming right up! That’s the latest from researchers analyzing NASA’s James Webb Space Telescope’s observations of HD 80606 b, an exoplanet four times the mass of Jupiter with an extremely elliptical orbit that sweeps close by its Sun-like star. The research team is presenting their study and preliminary findings Tuesday at the 248th meeting of the American Astronomical Society in Pasadena, California.
“Hot Jupiters are already considered some of the most extreme exoplanets we know of, but even among that population, HD 80606 b is one of the most extreme,” said Tiffany Kataria, the study’s principal investigator at NASA’s Jet Propulsion Laboratory in Southern California. “We typically think of hot Jupiters as hot gas giants sitting right next to their stars, but this planet’s highly eccentric orbit creates a completely different beast.”
As the planet plunges close to its star, Webb shows its temperature skyrockets by 1,100 degrees Fahrenheit. Previous studies have shown that radical temperature swings can cause an exoplanet’s chemistry and clouds to change in real time. According to the research team, the dynamic conditions of HD 80606 b make the planet an ideal target to observe these changes with Webb’s powerful instruments.
Image: Artist’s concept exoplanet HD 80606 b
This artist’s concept shows exoplanet HD 80606 b being “roasted” as its orbit approaches periastron, the point at which it is closest to its host star, which is similar to our Sun.
Artwork: NASA, ESA, CSA, Joseph Olmsted (STScI)
“Observing a planet like HD 80606 b is actually very efficient because its unusual orbit, with the corresponding swings in temperature and chemical composition, allow us to gather data under varying conditions in just hours and apply those findings to other hot Jupiters or more conventional exoplanets,” said Laura C. Mayorga, co-investigator on the study and an exoplanet astronomer at the Johns Hopkins Applied Physics Laboratory in Laurel, Maryland.
Measurements of temperature and chemical composition were done with spectroscopy, a technique scientists use to break light into its component colors to reveal information about the composition, temperature, motion, and physical properties of objects in space. The team used Webb’s MIRI (Mid-Infrared Instrument) for an extended observation of HD 80606 b before, during, and after its periastron, or closest pass by its star. During periastron, the planet also passed behind the star from Webb’s perspective in what’s known as a secondary eclipse. The observation was years in the planning, as scheduling the time to catch the planet at this point was complex given its extremely elliptical 111-day orbit, and Webb’s own restrictions on where it can look during specific times of the year, based on Earth’s position in orbit around the Sun.
Researchers say they have only begun to peel back the layers of an incredibly rich dataset, but they can clearly see a dramatic shift in the exoplanet’s temperature. “Webb has shown that the planet’s increase in temperature was even more extreme than we anticipated based on Spitzer data,” said Kataria.
In fact, the planet had already been dubbed the “roasted exoplanet” and even got its own poster in NASA’s popular series. NASA’s now-retired Spitzer Space Telescope laid the groundwork of infrared observations of HD 80606 b, showing that more detailed spectroscopic data from Webb would be especially compelling.
“Spitzer did amazing work on this exoplanet, and now Webb is building on that legacy by enabling us to drill down to distinguish specific chemical signatures like methane and carbon dioxide, which is just amazing progress,” said Ryan Challener, co-author and research associate at the Cornell Center for Astrophysics and Planetary Science. “There’s so much to learn from this one dataset here — we really are just getting started deciphering what Webb has to tell us.”
The James Webb Space Telescope is the world’s premier space science observatory. Webb is solving mysteries in our solar system, looking beyond to distant worlds around other stars, and probing the mysterious structures and origins of our universe and our place in it. Webb is an international program led by NASA with its partners, ESA (European Space Agency) and CSA (Canadian Space Agency).
The following sections contain links to download this article’s images and videos in all available resolutions followed by related information links, media contacts, and if available, research paper and Spanish translation links.
Related Images & Videos
HD 80606 b (Artist’s Concept)
This artist’s concept shows exoplanet HD 80606 b being “roasted” as its orbit approaches periastron, the point at which it is closest to its host star, which is similar to our Sun.
Description NASA astronaut Jessica Meir inspects optical fibers while installing hardware updates to the agency’s Cold Atom Lab, or CAL, aboard the International Space Station on May 8, 2026. About the size of a minifridge and operated from Earth, CAL chills atoms to...
2 Min Read
Astronaut Jessica Meir Assists With Hardware Updates for NASA’s Cold Atom Lab
PIA26725
Credits: NASA
Downloads
Astronaut Jessica Meir Assists With Hardware Updates for NASA’s Cold Atom Lab
JPEG (4.91 MB)
Description
NASA astronaut Jessica Meir inspects optical fibers while installing hardware updates to the agency’s Cold Atom Lab, or CAL, aboard the International Space Station on May 8, 2026.
About the size of a minifridge and operated from Earth, CAL chills atoms to temperatures below minus 459 degrees Fahrenheit (minus 273.15 degrees Celsius), so close to absolute zero that they form a large quantum object called a Bose-Einstein condensate (BEC) — a fifth state of matter distinct from solids, liquids, gases, and plasma. In a BEC, scientists can observe the quantum properties of atoms at a scale visible to the naked eye. For instance, atoms and particles sometimes behave like solid objects and sometimes behave like waves, a quantum property called “wave-particle duality.”
Managed by Caltech in Pasadena, NASA’s Jet Propulsion Laboratory designed, built, and operates Cold Atom Lab, which is sponsored by the Biological and Physical Sciences (BPS) division of NASA’s Science Mission Directorate at the agency’s headquarters in Washington. The BPS division pioneers scientific discovery and enables exploration by using space environments to conduct investigations that are not possible on Earth. Studying biological and physical phenomena under extreme conditions allows researchers to advance the fundamental scientific knowledge required to go farther and stay longer in space, while also benefiting life on Earth.
Researchers using two of humanity’s most powerful observatories — NASA’s James Webb and Hubble Space Telescopes — have definitively shown that Terzan 5 is not a globular star cluster as it was once classified, offering new insight into how galaxies like our own form and...
7 Min Read
NASA Webb, Hubble Reveal History of Relic of Milky Way’s Formation
New observations from Webb combined with multiple observations from Hubble prove that Terzan 5 is a self-contained, self-enriching stellar system that contains up to four distinct star populations. It orbits within our Milky Way galaxy’s central bulge.
Credits: Image: NASA, ESA, CSA, STScI, Giorgia Zullo (University of Bologna), Francesco Ferraro (University of Bologna); Image Processing: Alyssa Pagan (STScI)
Researchers using two of humanity’s most powerful observatories — NASA’s James Webb and Hubble Space Telescopes — have definitively shown that Terzan 5 is not a globular star cluster as it was once classified, offering new insight into how galaxies like our own form and evolve over time. A globular star cluster typically has only one ancient star population. New data not only confirms the existence of two distinct populations of stars in Terzan 5, but also provides evidence for two more recent rounds of star formation. Although located within the crowded bulge of our Milky Way, our galaxy’s central, spherical region of older stars, Terzan 5 was massive enough to maintain its separate identity while lighter weight systems spread out and mixed to form the bulge billions of years ago. It’s like a lump in an otherwise well-mixed cake batter.
“Webb’s new near-infrared observations, cross-referenced with Hubble’s archival observations, have given us a much clearer picture of the history of Terzan 5,” said Giorgia Zullo, who led the research and is a PhD student at the University of Bologna in Italy.
These results were presented at a press conference Tuesday at the 248th meeting of the American Astronomical Society in Pasadena, and were published in Astronomy & Astrophysics.
Image: Bulge Fossil Fragment Terzan 5 (Webb and Hubble Image)
New observations from Webb combined with multiple observations from Hubble prove that Terzan 5 is a self-contained, self-enriching stellar system that contains up to four distinct star populations. It orbits within our Milky Way galaxy’s central bulge.
Image: NASA, ESA, CSA, STScI, Giorgia Zullo (University of Bologna), Francesco Ferraro (University of Bologna); Image Processing: Alyssa Pagan (STScI)
Four generations of stars
Discovered in 1968 by astronomer Azop Terzan, Terzan 5 resembles a globular cluster in many ways. However, in 2009 this system was discovered to harbor two distinct populations of stars. In 2016 Hubble provided the first estimate of their ages, showing that one formed roughly 12 billion years ago — as the Milky Way itself was assembling — and the other about 5 billion years ago, just before Earth started forming. This pointed to a more complex history than a typical globular cluster.
Studying Terzan 5 is complicated by its location in a region of our galaxy crowded with stars and heavily obscured by dust. This is where Webb stepped in. Its infrared view allowed the research team to peer through the dust and catalog many more stars, and fainter stars, than previous work. By measuring star colors and brightnesses, astronomers can classify them into populations of different ages and chemistries.
Webb was able to measure these key properties for every star within the field of view in the sky — both stars within Terzan 5 and unrelated foreground stars. To isolate the stars of Terzan 5, the team relied on the power and longevity of Hubble. The 12-year separation allowed the team to measure very small movements of individual stars, known as proper motions, to determine which stars belong to Terzan 5 and which are part of the Milky Way bulge.
By combining data from both Webb and Hubble, the researchers found strong evidence for two more stellar populations, one that formed 3.8 billion years ago and another only 2.5 billion years ago. They also were able to determine the ages of the previously known stellar populations with unprecedented precision, finding that they formed 12.5 billion and 4.7 billion years ago.
With the previously known two generations of stars, astronomers could not rule out the possibility that Terzan 5 interacted with another object, like a globular cluster or a giant molecular cloud, becoming enriched with new gas and dust that set off a second round of star formation. With four stellar generations, those explanations are ruled out.
Measurements of the stellar composition of Terzan 5 populations made at the W. M. Keck Observatory and European Southern Observatory’s Very Large Telescope also point toward very distinct populations. “Along with the ages of these populations, the cluster preserves a fossil record of progressive enrichment of heavy elements by supernovae,” said co-author R. Michael Rich, a research astronomer at the University of California, Los Angeles.
Terzan 5 formed multiple generations of stars because it was able to retain the necessary raw materials. There is evidence of powerful supernova explosions in Terzan 5 that forged heavier elements that were swept up by subsequent generations of stars. In lighter weight systems, the force of the explosions themselves could have ejected the resulting elements as well as sweeping out leftover gas and dust. The progenitor of Terzan 5 had enough mass to retain those stars’ ejections, allowing new generations of stars to form over billions of years.
‘Bulge fossil fragment’
The results show that Terzan 5 is most likely the remnant of a much more massive stellar system that initially formed 12.5 billion years ago. Terzan 5 is extraordinary because it survived — and never merged or fully “mixed in” with the Milky Way’s bulge. “For some reason, this peculiar clump of stars formed separately from the bulge and was not destroyed as the bulge itself formed,” said Francesco R. Ferraro, a professor at the University of Bologna and principal investigator of the Webb observations. “Terzan 5 is what we now call a bulge fossil fragment because it resembles the primordial clumps that contributed to the formation of the bulge.”
To date, there’s one other known cosmic object like Terzan 5. Liller 1 was the second to be reclassified from a globular star cluster to a bulge fossil fragment. It also contains multiple generations of stars. There may be more objects like it. Between 40 to 50 additional globular clusters that orbit within the bulge will be examined by Ferraro’s team to determine if their stellar populations are all the same, like globular clusters, or have several generations, like bulge fossil fragments.
Video: Zoom to See Terzan 5 Near Our Milky Way Galaxy’s Bulge
Zoom in to Terzan 5, a star cluster that lies within the crowded central region of our Milky Way galaxy known as the bulge. The scene starts with a ground-based image of our Milky Way bulge and zooms in on and circles Terzan 5, ending with the composite image of the star system from the James Webb and Hubble Space Telescopes.
Potential parallels for galaxy formation near, far
Ultimately, this research may improve what we know about how the central bulges of galaxies form over hundreds of millions of years. “Based on observations and in-depth simulations, we think that galaxies in the early universe had huge disks of gas that fragmented into clumps and formed stars. These clumps migrated to the center of the galaxies, and many merged to form their bulges,” said Barbara Lanzoni, a co-author and associate professor at the University of Bologna. For example, Webb has turned up several examples of “clumpy” galaxies that were actively forming when the universe was only a few hundred million years old, like the clumps in the Firefly Sparkle galaxy. “Terzan 5 may provide direct evidence that can help explain how bulges formed in galaxies throughout the universe,” Lanzoni said.
The James Webb Space Telescope is the world’s premier space science observatory. Webb is solving mysteries in our solar system, looking beyond to distant worlds around other stars, and probing the mysterious structures and origins of our universe and our place in it. Webb is an international program led by NASA with its partners, ESA (European Space Agency) and CSA (Canadian Space Agency).
The Hubble Space Telescope has been operating for over three decades and continues to make ground-breaking discoveries that shape our fundamental understanding of the universe. Hubble is a project of international cooperation between NASA and ESA (European Space Agency). NASA’s Goddard Space Flight Center in Greenbelt, Maryland, manages the telescope and mission operations. Lockheed Martin Space, based in Denver, also supports mission operations at Goddard. The Space Telescope Science Institute in Baltimore, which is operated by the Association of Universities for Research in Astronomy, conducts Hubble science operations for NASA.
The following sections contain links to download this article’s images and videos in all available resolutions followed by related information links, media contacts, and if available, research paper and Spanish translation links.
Related Images & Videos
Bulge Fossil Fragment Terzan 5 (Webb and Hubble Image)
New observations from Webb combined with multiple observations from Hubble prove that Terzan 5 is a self-contained, self-enriching stellar system that contains up to four distinct star populations. It orbits within our Milky Way galaxy’s central bulge.
Terzan 5 (Webb and Hubble Compass Image)
This image of bulge fossil fragment Terzan 5 was captured by the James Webb and Hubble space telescopes. Webb’s data are from its NIRCam (Near-Infrared Camera) and Hubble’s from its Advanced Camera for Surveys (ACS). The image shows a scale bar, compass arrows, and co…
Zoom to See Terzan 5 Near Our Milky Way Galaxy’s Bulge
Zoom in to Terzan 5, a star cluster that lies within the crowded central region of our Milky Way galaxy known as the bulge. The scene starts with a ground-based image of our Milky Way bulge and zooms in on and circles Terzan 5, ending with the composite image of the star system f…
The Transient Artifact and Continuous Learning System (TACLS) leverages data from continuously operating satellite networks coupled with machine learning models to help meteorologists at the National Weather Service forecast flash floods more efficiently.
The Transient Artifact and Continuous Learning System (TACLS) leverages data from continuously operating satellite networks coupled with machine learning models to help meteorologists at the National Weather Service forecast flash floods more efficiently. This new software is the result of a collaboration between NASA’s Jet Propulsion Laboratory, the University of California, San Diego (UCSD), and the National Oceanic and Atmospheric Administration (NOAA) National Weather Service (NWS).
A visual analysis from a TACLS test prediction run using data from flash floods the week of Christmas, 2025. The image shows flash flood warning (FFW) probabilities generated by TACLS (in shades of red) and overlaid on areas that received flash flood warnings from the National Weather Service (in blue).
Credit: UCSD Scripps Institution of Oceanography
Created with support from NASA’s Earth Science Technology Office (ESTO), TACLS leverages machine learning to automatically locate evidence (unusual increases in atmospheric moisture) of impending flash flooding that meteorologists may otherwise miss as they analyze large amounts of data. TACLS flags that evidence, indicates where flash flooding could likely occur, and displays that information via a user-friendly visualization for human analysts to interpret. Those analysts can then decide whether to issue a flash flood warning or weather advisory.
This novel framework for tracking extreme weather events and predicting imminent flash floods operates in near real-time, producing forecasts in as little as fifteen minutes.
“That’s really what we wanted to do, to give meteorologists a tool to help decision making for flash flood warnings,” said Yehuda Bock, Distinguished Researcher at the UCSD Scripps Institution of Oceanography and principal investigator for TACLS.
In simulations testing, TACLS used data from diverse severe weather events—including atmospheric rivers, monsoonal convection, and tropical cyclone remnants—between 2017 and 2023 and successfully captured 93% of the issued flash-flood warnings. Meteorologists from the National Weather Service are currently working to incorporate TACLS into their existing systems for forecasting flash floods in Southern California.
A cyclone makes landfall across the California coast on November 19, 2024. TACLS will help give communities more time to prepare for impending severe weather.
Credit: NASA
This learning system has two main components. First, an analytic back-end software suite uses machine learning algorithms to process satellite data and determine areas at risk for flooding. Second, user-friendly visualization software highlights those areas for further analysis by humans.
The ACLS back-end software analyzes data from satellites in the Global Navigation Satellite System (GNSS), a constellation of satellite networks that drive navigation services around the world. Water vapor in the troposphere delays signals from these satellites as they travel to Earth. This signal delay can be analyzed to calculate the amount of water vapor in the atmosphere over a particular location on Earth.
The TACLS analytic back-end software suite features a machine learning model trained using more than 30 years of past GNSS data. This model is an anomaly detector that tracks unusual increases in atmospheric moisture. The model then carefully examines that atmospheric moisture data and determines whether it’s either an artifact (a false feature or distortion in the data) or a transient (a time-sensitive physical event, like heavy precipitation) that requires interpretation by human analysts.
If TACLS determines the data represents a transient, such as an extreme weather event that warrants a flash flood warning, it will forward that data to the TACLS visualization software (MGViz) for further evaluation by humans. The analysts use their judgement and experience to interpret these events and determine whether the flagged data indicates a flash flood is likely, and, if necessary, issue a flash flood warning.
Several past innovations developed at JPL are leveraged by TACLS to process GNSS data and present the results. The analytic back-end software suite incorporates elements from JPL’s Domain-agnostic Outlier Ranking Algorithms program and the Time-series Forecasting, Evaluation, and Deployment program. The TACLS visualizer is based on the Multi-Mission Geographic Information System, originally developed at JPL for NASA’s Mars missions.
The TACLS software binds all these components within a novel system that enhances existing methods to reduce the amount of time it takes for a human analyst to determine whether to issue a flash flood warning.
Both the TACLS software and the data used to train it will be open-source, allowing scientists to either tailor this model in response to their unique research needs or create their own model from scratch.