• maiweb v0.1.0
  • ★
  • Feedback

#economics

2 sources tagged with this.

  • Calculated Risk
  • Freakonomics
  • Calculated Risk calculatedriskblog.com business calculated-risk economics finance housing 2026-01-12 13:21

    ↗

    I've been thinking about this for some time.After 21 years of writing this blog almost daily, I've decided to stop writing the daily updates on the blog.However, the economic data "IV" is still in my arm, and I'll be writing a weekly economic summary at the end of each week...

    I've been thinking about this for some time.

    After 21 years of writing this blog almost daily, I've decided to stop writing the daily updates on the blog.

    However, the economic data "IV" is still in my arm, and I'll be writing a weekly economic summary at the end of each week (via a newsletter - see below). This will have three parts: the Schedule of economic data for the following week, a Review of data for the previous week, and a Commentary on a current topic. 

    And I'll be writing the Real Estate Newsletter usually 4 to 6 times per week (this remains my main focus).

    Thanks for reading the blog all these years! I hope it has been useful and informative.

    Thanks to all the people who have helped me over the years.  And a special thanks to my friend Tanta; I miss her dearly.   Best to all.

    I'm on Threads and Bluesky.

    The weekly update will be here:
    and the Real Estate Newsletter (published 4 to 6 times per week) is here:
  • Calculated Risk calculatedriskblog.com business calculated-risk economics finance housing 2026-01-12 00:50

    ↗

    Weekend: • Schedule for Week of January 11, 2026 Monday: • No major economic releases scheduled. From CNBC: Pre-Market Data and Bloomberg futures S&P 500 futures are down 16 and DOW futures are down 104 (fair value). Oil prices were up over the last week with WTI futures at...

    Weekend:
    • Schedule for Week of January 11, 2026

    Monday:
    • No major economic releases scheduled.

    From CNBC: Pre-Market Data and Bloomberg futures S&P 500 futures are down 16 and DOW futures are down 104 (fair value).

    Oil prices were up over the last week with WTI futures at $59.37 per barrel and Brent at $63.60 per barrel. A year ago, WTI was at $77, and Brent was at $80 - so WTI oil prices are down about 24% year-over-year.

    Here is a graph from Gasbuddy.com for nationwide gasoline prices. Nationally prices are at $2.74 per gallon. A year ago, prices were at $3.03 per gallon, so gasoline prices are down $0.29 year-over-year.
  • Calculated Risk calculatedriskblog.com business calculated-risk economics finance housing 2026-01-11 13:12

    ↗

    Hotel occupancy was weak in 2025.   It is difficult to tell early in the year because travel is always weak in early January.  From STR: U.S. hotel results for week ending 3 JanuaryThe U.S. hotel industry reported positive year-over-year comparisons, according to CoStar’s...

    Hotel occupancy was weak in 2025.   It is difficult to tell early in the year because travel is always weak in early January. 

    From STR: U.S. hotel results for week ending 3 January
    The U.S. hotel industry reported positive year-over-year comparisons, according to CoStar’s latest data through 3 January. ...

    28 December 2025 through 3 January 2026 (percentage change from comparable week in 2024 and 2025):

    • Occupancy: 50.5% (+4.4%)
    • Average daily rate (ADR): US$175.47 (+3.4%)
    • Revenue per available room (RevPAR): US$88.65 (+7.9%)
    emphasis added
    The following graph shows the seasonal pattern for the hotel occupancy rate using the four-week average.

    Hotel Occupancy RateClick on graph for larger image.

    The red line is for 2026, blue is the median, and dashed light blue is for 2025.  Dashed black is for 2018, the record year for hotel occupancy. 

    It is difficult to judge performance early in the year.

    Note: Y-axis doesn't start at zero to better show the seasonal change.

    The 4-week average will increase seasonally for the next few months.
     
  • Calculated Risk calculatedriskblog.com business calculated-risk economics finance housing 2026-01-10 19:11

    ↗

    At the Calculated Risk Real Estate Newsletter this week: Click on graph for larger image. • Housing Starts Decreased to 1.246 million Annual Rate in October • The "Home ATM" Mostly Closed in Q3 • 1st Look at Local Housing Markets in December • Asking Rents Decline...

    At the Calculated Risk Real Estate Newsletter this week:

    Multi Housing Starts and Single Family Housing StartsClick on graph for larger image.

    • Housing Starts Decreased to 1.246 million Annual Rate in October

    • The "Home ATM" Mostly Closed in Q3

    • 1st Look at Local Housing Markets in December

    • Asking Rents Decline Year-over-year

    • Update: The Housing Bubble and Mortgage Debt as a Percent of GDP

    This is usually published 4 to 6 times a week and provides more in-depth analysis of the housing market.

  • Calculated Risk calculatedriskblog.com business calculated-risk economics finance housing 2026-01-10 13:11

    ↗

    The key reports this week are December CPI, Existing Home Sales and November Retail Sales. Also, New Home Sales for September and October will be released. For manufacturing, the December Industrial Production report and the January New York and Philly Fed manufacturing...

    The key reports this week are December CPI, Existing Home Sales and November Retail Sales. Also, New Home Sales for September and October will be released.

    For manufacturing, the December Industrial Production report and the January New York and Philly Fed manufacturing surveys will be released.

    ----- Monday, January 12th -----

    No major economic releases scheduled.

    ----- Tuesday, January 13th -----

    6:00 AM: NFIB Small Business Optimism Index for December.

    8:30 AM: The Consumer Price Index for December from the BLS. The consensus is for 0.3% increase in CPI, and a 0.3% increase in core CPI.  The consensus is for CPI to be up 2.7% year-over-year and core CPI to be up 2.7% YoY.

    New Home Sales10:00 AM: New Home Sales for September and October from the Census Bureau.

    This graph shows New Home Sales since 1963 through August 2025.

    The dashed line is the sales rate for August.

    The consensus is for 714 thousand SAAR for October.

    ----- Wednesday, January 14th -----

    7:00 AM ET: The Mortgage Bankers Association (MBA) will release the results for the mortgage purchase applications index. This will be two weeks of data.

    8:30 AM ET: The Producer Price Index for December from the BLS. The consensus is for a 0.3% increase in PPI, and a 0.2% increase in core PPI.

    Retail Sales 8:30 AM: Retail sales for November is scheduled to be released.  

    The consensus is for a 0.4% increase in retail sales.

    This graph shows retail sales since 1992. 

    This is monthly retail sales and food service, seasonally adjusted (total and ex-gasoline).

    December retail sales for December have not been scheduled yet.

    Existing Home Sales10:00 AM: Existing Home Sales for December from the National Association of Realtors (NAR). The consensus is for 4.23 million SAAR, up from 4.13 million.

    The graph shows existing home sales from 1994 through the report last month.

    2:00 PM: the Federal Reserve Beige Book, an informal review by the Federal Reserve Banks of current economic conditions in their Districts.

    ----- Thursday, January 15th -----

    8:30 AM: The initial weekly unemployment claims report will be released.  The consensus is for 208K, unchanged from 208K.

    8:30 AM: The New York Fed Empire State manufacturing survey for January. The consensus is for a reading of 1.0, down from -3.9.

    8:30 AM: the Philly Fed manufacturing survey for January.  The consensus is for a reading of -5.0, up from -10.2.
    ----- Friday, January 16th -----

    Industrial Production 9:15 AM: The Fed will release Industrial Production and Capacity Utilization for December.

    This graph shows industrial production since 1967.

    The consensus is for a 0.2% increase in Industrial Production, and for Capacity Utilization to be unchanged at 76.0%.

    10:00 AM: The January NAHB homebuilder survey. 

    The consensus is for a reading of 40, up from 39 the previous month. Any number below 50 indicates that more builders view sales conditions as poor than good.
  • Calculated Risk calculatedriskblog.com business calculated-risk economics finance housing 2026-01-09 19:15

    ↗

    Today, in the Calculated Risk Real Estate Newsletter: The "Home ATM" Mostly Closed in Q3 A brief excerpt: During the housing bubble, many homeowners borrowed heavily against their perceived home equity - jokingly calling it the “Home ATM” - and this contributed to the...

    Today, in the Calculated Risk Real Estate Newsletter: The "Home ATM" Mostly Closed in Q3

    A brief excerpt:
    During the housing bubble, many homeowners borrowed heavily against their perceived home equity - jokingly calling it the “Home ATM” - and this contributed to the subsequent housing bust, since so many homeowners had negative equity in their homes when house prices declined.
    ...
    Months of SupplyHere is the quarterly increase in mortgage debt from the Federal Reserve’s Financial Accounts of the United States - Z.1 (sometimes called the Flow of Funds report) released today. In the mid ‘00s, there was a large increase in mortgage debt associated with the housing bubble.

    In Q3 2025, mortgage debt increased $108 billion, unchanged from $108 billion in Q2. Note the almost 7 years of declining mortgage debt as distressed sales (foreclosures and short sales) wiped out a significant amount of debt.

    However, some of this debt is being used to increase the housing stock (purchase new homes), so this isn’t all Mortgage Equity Withdrawal (MEW).

  • Calculated Risk calculatedriskblog.com business calculated-risk economics finance housing 2026-01-09 18:12

    ↗

    The Federal Reserve released the Q3 2025 Flow of Funds report today: Financial Accounts of the United States. The net worth of households and nonprofits rose to $181.6 trillion during the third quarter of 2025. The value of directly and indirectly held corporate equities...

    The Federal Reserve released the Q3 2025 Flow of Funds report today: Financial Accounts of the United States.
    The net worth of households and nonprofits rose to $181.6 trillion during the third quarter of 2025. The value of directly and indirectly held corporate equities increased $5.5 trillion and the value of real estate decreased $0.3 trillion.
    ...
    Household debt increased 4.1 percent at an annual rate in the third quarter of 2025. Consumer credit grew at an annual rate of 2.3 percent, while mortgage debt (excluding charge-offs) grew at an annual rate of 3.2 percent.
    Household Net Worth as Percent of GDP Click on graph for larger image.

    The first graph shows Households and Nonprofit net worth as a percent of GDP.  

    Net worth increased $6.1 trillion in Q3.  As a percent of GDP, net worth increased in Q3 but is still below the peak in 2021.

    This includes real estate and financial assets (stocks, bonds, pension reserves, deposits, etc.) net of liabilities (mostly mortgages). Note that this does NOT include public debt obligations.

    Household Percent EquityThe second graph shows homeowner percent equity since 1952.

    Household percent equity (as measured by the Fed) collapsed when house prices fell sharply in 2007 and 2008.

    In Q3 2025, household percent equity (of household real estate) was at 71.6% - down from 72.0% in Q2, 2025

    Note: This includes households with no mortgage debt.

    Household Real Estate Assets Percent GDP The third graph shows household real estate assets and mortgage debt as a percent of GDP.  

    Mortgage debt increased by $108 billion in Q3.

    Mortgage debt is up $2.99 trillion from the peak during the housing bubble, but, as a percent of GDP is at 43.9% - down from Q2 - and down from a peak of 73.1% of GDP during the housing bust.

    The value of real estate, as a percent of GDP, decreased in Q3 and is below the recent peak in Q2 2022, but is well above the median of the last 30 years.
  • Calculated Risk calculatedriskblog.com business calculated-risk economics finance housing 2026-01-09 15:34

    ↗

    Today, in the Calculated Risk Real Estate Newsletter: Housing Starts Decreased to 1.246 million Annual Rate in October A brief excerpt: Note: The Census Bureau is still catching up. They released Start data for September and October today, but we are still missing November...

    Today, in the Calculated Risk Real Estate Newsletter: Housing Starts Decreased to 1.246 million Annual Rate in October

    A brief excerpt:
    Note: The Census Bureau is still catching up. They released Start data for September and October today, but we are still missing November data.
    ...
    The third graph shows the month-to-month comparison for total starts between 2024 (blue) and 2025 (red).

    Starts 2024 vs 2025Total starts were down 7.8% in October compared to October 2024.

    Year-to-date (YTD) starts are down 0.7% compared to the same period in 2024. Single family starts are down 7.0% YTD and multi-family up 18.0% YTD.
    There is much more in the article.

  • Calculated Risk calculatedriskblog.com business calculated-risk economics finance housing 2026-01-09 14:59

    ↗

    From the Census Bureau: Permits, Starts and Completions Housing Starts: Privately-owned housing starts in October were at a seasonally adjusted annual rate of 1,246,000. This is 4.6 percent below the revised September estimate of 1,306,000 and is 7.8 percent below the October...

    From the Census Bureau: Permits, Starts and Completions
    Housing Starts:
    Privately-owned housing starts in October were at a seasonally adjusted annual rate of 1,246,000. This is 4.6 percent below the revised September estimate of 1,306,000 and is 7.8 percent below the October 2024 rate of 1,352,000. Single-family housing starts in October were at a rate of 874,000; this is 5.4 percent above the revised September figure of 829,000. The October rate for units in buildings with five units or more was 347,000.

    Building Permits:
    Privately-owned housing units authorized by building permits in October were at a seasonally adjusted annual rate of 1,412,000. This is 0.2 percent below the revised September rate of 1,415,000 and is 1.1 percent below the October 2024 rate of 1,428,000. Single-family authorizations in October were at a rate of 876,000; this is 0.5 percent below the revised September figure of 880,000. Authorizations of units in buildings with five units or more were at a rate of 481,000 in October.
    emphasis added
    Multi Housing Starts and Single Family Housing StartsClick on graph for larger image.

    The first graph shows single and multi-family housing starts since 2000.

    Multi-family starts (blue, 2+ units) decreased month-over-month in October.   Multi-family starts were down 7.9% year-over-year.

    Single-family starts (red) increased in October and were down 7.8% year-over-year.

    Multi Housing Starts and Single Family Housing StartsThe second graph shows single and multi-family housing starts since 1968.

    Total housing starts in October were well below expectations.   We are still missing data for November due to the government shutdown.

    I'll have more later …
  • Calculated Risk calculatedriskblog.com business calculated-risk economics finance housing 2026-01-09 14:20

    ↗

    The headline jobs number in the December employment report was slightly below expectations, however October and November were revised down by 76,000. The unemployment rate decreased to 4.4%.Earlier: December Employment Report: 50 thousand Jobs, 4.4% Unemployment RatePrime (25...

    The headline jobs number in the December employment report was slightly below expectations, however October and November were revised down by 76,000. The unemployment rate decreased to 4.4%.

    Earlier: December Employment Report: 50 thousand Jobs, 4.4% Unemployment Rate

    Prime (25 to 54 Years Old) Participation

    Employment Population Ratio, 25 to 54Since the overall participation rate is impacted by both cyclical (recession) and demographic (aging population, younger people staying in school) reasons, here is the employment-population ratio for the key working age group: 25 to 54 years old.

    The 25 to 54 years old participation rate was unchanged in December at 83.8%% from 83.8% in November.

    The 25 to 54 employment population ratio increased to 80.7% from 80.6% the previous month.

    Both are down slightly from the recent peaks, but still near the highest level this millennium.

    Average Hourly Wages

    WagesThe graph shows the nominal year-over-year change in "Average Hourly Earnings" for all private employees from the Current Employment Statistics (CES).  

    There was a huge increase at the beginning of the pandemic as lower paid employees were let go, and then the pandemic related spike reversed a year later.

    Wage growth has trended down after peaking at 5.9% YoY in March 2022 and was at 3.8% YoY in December, up from 3.6% YoY in November. 

    Part Time for Economic Reasons

    Part Time WorkersFrom the BLS report:
    "The number of people employed part time for economic reasons, at 5.3 million, changed little in December but is up by 980,000 over the year. These individuals would have preferred full-time employment but were working part time because their hours had been reduced or they were unable to find full-time jobs."
    The number of persons working part time for economic reasons decreased in December to 5.34 million from 5.49 million in November.  This is well above the pre-pandemic levels and near the highest levels since mid-2021.

    These workers are included in the alternate measure of labor underutilization (U-6) that decreased to 8.4% from 8.7% in November. This is down from the record high in April 2020 of 22.9% and up from the lowest level on record (seasonally adjusted) in December 2022 (6.6%). (This series started in 1994). This measure is well above the 7.0% level in February 2020 (pre-pandemic).

    Unemployed over 26 Weeks

    Unemployed Over 26 WeeksThis graph shows the number of workers unemployed for 27 weeks or more.

    According to the BLS, there are 1.95 million workers who have been unemployed for more than 26 weeks and still want a job, up from 1.91 million in November.

    This is down from post-pandemic high of 4.171 million, and up from the recent low of 1.056 million.

    This is above pre-pandemic levels.

    Summary:

    The headline jobs number in the December employment report was slightly below expectations, however October and November were revised down by 76,000.  The unemployment rate decreased to 4.4%.

    This was another weak employment report.  
  • Calculated Risk calculatedriskblog.com business calculated-risk economics finance housing 2026-01-09 13:30

    ↗

    From the BLS: Employment Situation Both total nonfarm payroll employment (+50,000) and the unemployment rate (4.4 percent) changed little in December, the U.S. Bureau of Labor Statistics reported today. Employment continued to trend up in food services and drinking places,...

    From the BLS: Employment Situation
    Both total nonfarm payroll employment (+50,000) and the unemployment rate (4.4 percent) changed little in December, the U.S. Bureau of Labor Statistics reported today. Employment continued to trend up in food services and drinking places, health care, and social assistance. Retail trade lost jobs.
    ...
    The change in total nonfarm payroll employment for October was revised down by 68,000, from -105,000 to -173,000, and the change for November was revised down by 8,000, from +64,000 to +56,000. With these revisions, employment in October and November combined is 76,000 lower than previously reported.
    emphasis added
    Employment per monthClick on graph for larger image.

    The first graph shows the jobs added per month since January 2021.

    Total payrolls increased by 50 thousand in December.  Private payrolls increased by37 thousand, and public payrolls increased 13 thousand.

    Payrolls for October and November were revised down by 76 thousand, combined.  The economy has only added 93 thousand jobs since April (8 months).

    Year-over-year change employment The second graph shows the year-over-year change in total non-farm employment since 1968.

    In December, the year-over-year change was 0.594 million jobs.  

    Year-over-year employment growth has slowed sharply.


    The third graph shows the employment population ratio and the participation rate.

    Employment Pop Ratio and participation rate The Labor Force Participation Rate decreased to 62.4% in December, from 62.5% in November. This is the percentage of the working age population in the labor force.

    The Employment-Population ratio increased to 59.7% from 59.6% in November (blue line).

    I'll post the 25 to 54 age group employment-population ratio graph later.


    unemployment rateThe fourth graph shows the unemployment rate.

    The unemployment rate was decreased to 4.4% in December from 4.5% in November.  

    This was slightly below consensus expectations, however, October and November payrolls were revised down by 76,000 combined.

    Overall another weak report.

    I'll have more later ...
  • Calculated Risk calculatedriskblog.com business calculated-risk economics finance housing 2026-01-09 01:03

    ↗

    Note: Mortgage rates are from MortgageNewsDaily.com and are for top tier scenarios. Friday: • At 8:30 AM ET,: Employment Report for December.   The consensus is for 55,000 jobs added, and for the unemployment rate to decline to 4.5%. • At 10:00 AM: Housing Starts for...

    Mortgage Rates Note: Mortgage rates are from MortgageNewsDaily.com and are for top tier scenarios.

    Friday:
    • At 8:30 AM ET,: Employment Report for December.   The consensus is for 55,000 jobs added, and for the unemployment rate to decline to 4.5%.

    • At 10:00 AM: Housing Starts for September and October.

    • At 10:00 AM: University of Michigan's Consumer sentiment index (Preliminary for January)

    • At 12:00 PM: Q3 Flow of Funds Accounts of the United States from the Federal Reserve.
  • Calculated Risk calculatedriskblog.com business calculated-risk economics finance housing 2026-01-08 19:16

    ↗

    On Friday at 8:30 AM ET, the BLS will release the employment report for December. The consensus is for 55,000 jobs added, and for the unemployment rate to decrease to 4.5%. There were 64,000 jobs added in November, and the unemployment rate was at 4.6%. From Goldman Sachs: We...

    On Friday at 8:30 AM ET, the BLS will release the employment report for December. The consensus is for 55,000 jobs added, and for the unemployment rate to decrease to 4.5%. There were 64,000 jobs added in November, and the unemployment rate was at 4.6%.

    From Goldman Sachs:
    We forecast that payrolls rose 70k (vs. 55k consensus) in December and the unemployment rate fell to 4.5% (vs. 4.5% consensus). ... We expect the unemployment rate to edge down to 4.5% because the increase to 4.6% in November largely reflected the impact of furloughed federal government workers during the shutdown.
    emphasis added
    From BofA:
    Dec NFP are likely to tick up to a stable 70k (private: 75k) print, higher than consensus expectations. Initial claims remain low and continuing claims have trended lower since Oct. Education & health jobs should remain the driver of payroll growth. Given the strength in air travel and holiday spending, we project a rise in leisure & hospitality jobs. After the u-rate jumping to 4.6% in Nov, in part due to shutdown-related distortions, we expect a decline to 4.5%. It is likely that the worst is behind us in the labor market.
    • ADP Report: The ADP employment report showed 41,000 private sector jobs were added in December.  This was slightly below consensus forecasts.  However, in general, ADP hasn't been very useful in forecasting the BLS report.

    • ISM Surveys: Note that the ISM indexes are diffusion indexes based on the number of firms hiring (not the number of hires).  The ISM® manufacturing employment index increased to 44.9%, up from 44.0% the previous month. This suggests manufacturing jobs lost in December. The ADP report indicated 5,000 manufacturing jobs lost in December.

    The ISM® services employment index increased to 52.0%, up from 48.9%.  This suggests job gains in December.  

    • Unemployment Claims: The weekly claims report showed about the same number of initial unemployment claims during the reference week at 224,000 in December compared to 222,000 in November.  This suggests about the same number of layoffs in December as in November.

    • Conclusion: Over the last 6 months, employment gains averaged 17 thousand per month.  The ADP report, the ISM Surveys, and unemployment claims suggest similar gains in December compared to November.   I'll take the over for December - but still weak hiring.
  • Calculated Risk calculatedriskblog.com business calculated-risk economics finance housing 2026-01-08 15:52

    ↗

    From Manheim Consulting today: Manheim Used Vehicle Value Index: December 2025 TrendsThe Manheim Used Vehicle Value Index (MUVVI) rose to 205.5, reflecting a 0.4% increase for wholesale used-vehicle prices (adjusted for mix, mileage, and seasonality) compared to December...

    From Manheim Consulting today: Manheim Used Vehicle Value Index: December 2025 Trends
    The Manheim Used Vehicle Value Index (MUVVI) rose to 205.5, reflecting a 0.4% increase for wholesale used-vehicle prices (adjusted for mix, mileage, and seasonality) compared to December 2024. The December index is up 0.1% month over month.
    emphasis added
    Manheim Used Vehicle Value Index Click on graph for larger image.

    This index from Manheim Consulting is based on all completed sales transactions at Manheim’s U.S. auctions.

    The Manheim index suggests used car prices increased in December (seasonally adjusted) and were up 0.4% YoY.
  • Calculated Risk calculatedriskblog.com business calculated-risk economics finance housing 2026-01-08 13:48

    ↗

    The Census Bureau and the Bureau of Economic Analysis reported: The U.S. Census Bureau and the U.S. Bureau of Economic Analysis announced today that the goods and services deficit was $29.4 billion in October, down $18.8 billion from $48.1 billion in September, revised....

    The Census Bureau and the Bureau of Economic Analysis reported:
    The U.S. Census Bureau and the U.S. Bureau of Economic Analysis announced today that the goods and services deficit was $29.4 billion in October, down $18.8 billion from $48.1 billion in September, revised.

    October exports were $302.0 billion, $7.8 billion more than September exports. October imports were $331.4 billion, $11.0 billion less than September imports.
    emphasis added
    U.S. Trade Exports Imports Click on graph for larger image.

    Exports increased and imports decreased in October. 

    Exports were up 12% year-over-year; imports were down 4% year-over-year.

    Imports increased sharply earlier this year as importers rushed to beat tariffs.  

    The second graph shows the U.S. trade deficit, with and without petroleum.

    U.S. Trade Deficit The blue line is the total deficit, and the black line is the petroleum deficit, and the red line is the trade deficit ex-petroleum products.

    Note that net, exports of petroleum products are positive and have been increasing.

    The trade deficit with China decreased to $14.9 billion from $28.1 billion a year ago.
  • Calculated Risk calculatedriskblog.com business calculated-risk economics finance housing 2026-01-08 13:30

    ↗

    The DOL reported: In the week ending January 3, the advance figure for seasonally adjusted initial claims was 208,000, an increase of 8,000 from the previous week's revised level. The previous week's level was revised up by 1,000 from 199,000 to 200,000. The 4-week moving...

    The DOL reported:
    In the week ending January 3, the advance figure for seasonally adjusted initial claims was 208,000, an increase of 8,000 from the previous week's revised level. The previous week's level was revised up by 1,000 from 199,000 to 200,000. The 4-week moving average was 211,750, a decrease of 7,250 from the previous week's revised average. This is the lowest level for this average since April 27, 2024 when it was 210,250. The previous week's average was revised up by 250 from 218,750 to 219,000.
    emphasis added
    The following graph shows the 4-week moving average of weekly claims since 1971.

    Click on graph for larger image.

    The dashed line on the graph is the current 4-week average. The four-week average of weekly unemployment claims decreased to 211,750.

    This was slightly above the consensus estimate.
  • Calculated Risk calculatedriskblog.com business calculated-risk economics finance housing 2026-01-08 00:48

    ↗

    Note: Mortgage rates are from MortgageNewsDaily.com and are for top tier scenarios. Thursday: • At 8:30 A ET, Trade Balance report for November from the Census Bureau. The consensus is the trade deficit to be $59.4 billion.  The U.S. trade deficit was at $52.8 billion in...

    Mortgage Rates Note: Mortgage rates are from MortgageNewsDaily.com and are for top tier scenarios.

    Thursday:
    • At 8:30 A ET, Trade Balance report for November from the Census Bureau. The consensus is the trade deficit to be $59.4 billion.  The U.S. trade deficit was at $52.8 billion in September.

    • Also at 8:30 AM, The initial weekly unemployment claims report will be released.  The consensus is for 205K, up from 199K.
  • Calculated Risk calculatedriskblog.com business calculated-risk economics finance housing 2026-01-07 17:37

    ↗

    Today, in the Calculated Risk Real Estate Newsletter: 1st Look at Local Housing Markets in December A brief excerpt: Last year (2025) might have seen the lowest number of existing home sales since 1995. It will be close! Even if sales beat 2024 sales, these will be the two...

    Today, in the Calculated Risk Real Estate Newsletter: 1st Look at Local Housing Markets in December

    A brief excerpt:
    Last year (2025) might have seen the lowest number of existing home sales since 1995. It will be close! Even if sales beat 2024 sales, these will be the two lowest sales years since 1995. Sales will be worse than any year during the housing bust.

    Most readers probably don’t remember 1995, but I do! If I went to an open house ‘95, I was frequently the only person to visit all day. Just me and the crickets.

    December sales will be mostly for contracts signed in October and November, and mortgage rates averaged 6.25% in October and 6.24% in November (lower than for closed sales in November). ...

    Closed Existing Home SalesIn December, sales in these early reporting markets were up 2.5% YoY. Last month, in November, these same markets were down 10.8% year-over-year Not Seasonally Adjusted (NSA).

    Important: There was one more working days in December 2025 (22) as in December 2024 (21). So, the year-over-year change in the headline SA data will be less than the change in NSA data (there are other seasonal factors).
    ...
    This was just several early reporting markets. Many more local markets to come!
    There is much more in the article.

  • Calculated Risk calculatedriskblog.com business calculated-risk economics finance housing 2026-01-07 15:12

    ↗

    (Posted with permission). The ISM® Services index was at 54.4%, up from 52.6% the previous month. The employment index increased to 52.0%, up from 48.9%. Note: Above 50 indicates expansion, below 50 in contraction. From the Institute for Supply Management: Services PMI® at...

    (Posted with permission). The ISM® Services index was at 54.4%, up from 52.6% the previous month. The employment index increased to 52.0%, up from 48.9%. Note: Above 50 indicates expansion, below 50 in contraction.

    From the Institute for Supply Management: Services PMI® at 54.4% December 2025 ISM® Services PMI® Report
    Economic activity in the services sector continued to expand in December, say the nation’s purchasing and supply executives in the latest ISM® Services PMI® Report. The Services PMI® registered at 54.4 percent, finishing 2025 on a positive note with its 10th month in expansion territory — and its highest reading — of the year.

    The report was issued today by Steve Miller, CPSM, CSCP, Chair of the Institute for Supply Management® (ISM®) Services Business Survey Committee:

    “In December, the Services PMI® registered a reading of 54.4 percent, 1.8 percentage points higher than the November figure of 52.6 percent and a third consecutive month of expansion. The Business Activity Index continued in expansion territory in December, registering 56 percent, 1.5 percentage points higher than the reading of 54.5 percent recorded in November. The New Orders Index also remained in expansion in December, with a reading of 57.9 percent, 5 percentage points above November’s figure of 52.9 percent. The Employment Index expanded for the first time in seven months with a reading of 52 percent, a 3.1-percentage point improvement from the 48.9 percent recorded in November — the fifth consecutive monthly increase since a reading of 46.4 percent in July.

    “The Supplier Deliveries Index registered 51.8 percent, 2.3 percentage points lower than the 54.1 percent recorded in November. This is the 13th consecutive month that the index has been in expansion territory, indicating slower supplier delivery performance. (Supplier Deliveries is the only ISM® PMI® Reports index that is inversed; a reading of above 50 percent indicates slower deliveries, which is typical as the economy improves and customer demand increases.)

    “The Prices Index registered 64.3 percent in December, its lowest level since a reading of 60.9 percent in March 2025. The December figure was a 1.1-percentage point drop from November’s reading of 65.4 percent. The index has exceeded 60 percent for 13 straight months.br /> emphasis added
    Employment expanded following six consecutive month of contraction.
  • Calculated Risk calculatedriskblog.com business calculated-risk economics finance housing 2026-01-07 15:00

    ↗

    From the BLS: Job Openings and Labor Turnover Summary The number of job openings was little changed at 7.1 million in November, the U.S. Bureau of Labor Statistics reported today. Over the month, hires were little changed and total separations were unchanged at 5.1 million...

    From the BLS: Job Openings and Labor Turnover Summary
    The number of job openings was little changed at 7.1 million in November, the U.S. Bureau of Labor Statistics reported today. Over the month, hires were little changed and total separations were unchanged at 5.1 million each. Within separations, both quits (3.2 million) and layoffs and discharges (1.7 million) were little changed.
    emphasis added
    The following graph shows job openings (black line), hires (dark blue), Layoff, Discharges and other (red column), and Quits (light blue column) from the JOLTS.

    This series started in December 2000.

    Note: The difference between JOLTS hires and separations is similar to the CES (payroll survey) net jobs headline numbers. This report is for November; the employment report to be released on Friday will be for December.

    Job Openings and Labor Turnover Survey Click on graph for larger image.

    Note that hires (dark blue) and total separations (red and light blue columns stacked) are usually pretty close each month. This is a measure of labor market turnover.  When the blue line is above the two stacked columns, the economy is adding net jobs - when it is below the columns, the economy is losing jobs.

    The spike in layoffs and discharges in March 2020 is labeled, but off the chart to better show the usual data.

    Jobs openings decreased in November to 7.15 million from 7.45 million in October.

    The number of job openings (black) were down 11% year-over-year. 

    Quits were up 4% year-over-year. These are voluntary separations. (See light blue columns at bottom of graph for trend for "quits").
  • Calculated Risk calculatedriskblog.com business calculated-risk economics finance housing 2026-01-07 13:15

    ↗

    From ADP: ADP National Employment Report: Private Sector Employment Increased by 41,000 Jobs in December; Annual Pay was Up 4.4%“Small establishments recovered from November job losses with positive end-of-year hiring, even as large employers pulled back,” said Dr. Nela...

    From ADP: ADP National Employment Report: Private Sector Employment Increased by 41,000 Jobs in December; Annual Pay was Up 4.4%
    “Small establishments recovered from November job losses with positive end-of-year hiring, even as large employers pulled back,” said Dr. Nela Richardson, chief economist, ADP.
    emphasis added
    This was below the consensus forecast of 50,000 jobs added. The BLS will report on Friday, and the consensus is for 55,000 jobs added.
  • Calculated Risk calculatedriskblog.com business calculated-risk economics finance housing 2026-01-07 12:00

    ↗

    From the MBA: MMortgage Applications Decreased Over a Two-Week Period in Latest MBA Weekly SurveyMortgage applications decreased 9.7 percent from two weeks earlier, according to data from the Mortgage Bankers Association’s (MBA) Weekly Mortgage Applications Survey for the...

    From the MBA: MMortgage Applications Decreased Over a Two-Week Period in Latest MBA Weekly Survey
    Mortgage applications decreased 9.7 percent from two weeks earlier, according to data from the Mortgage Bankers Association’s (MBA) Weekly Mortgage Applications Survey for the week ending January 2, 2026. The results include an adjustment for the holidays.

    The Market Composite Index, a measure of mortgage loan application volume, decreased 9.7 percent on a seasonally adjusted basis from two weeks earlier. On an unadjusted basis, the Index decreased 28 percent compared with two weeks ago. The holiday adjusted Refinance Index decreased 14 percent from two weeks ago and was 133 percent higher than the same week one year ago. The unadjusted Refinance Index decreased 31 percent from two weeks ago and was 108 percent higher than the same week one year ago. The seasonally adjusted Purchase Index decreased 6 percent from two weeks earlier. The unadjusted Purchase Index decreased 23 percent compared with two weeks ago and was 10 percent higher than the same week one year ago.

    “Mortgage rates started the New Year with a decline to 6.25 percent, the lowest level since September 2024. Refinance applications were up 7 percent for the week but were at a slower pace than in the weeks leading up to the holidays,” said Joel Kan, MBA’s Vice President and Deputy Chief Economist. “FHA refinance applications saw a 19 percent increase, although that was a partial rebound from a drop the week before. MBA continues to expect mortgage rates to stay around current levels, with spells of refinance opportunities in the weeks when rates move lower.”

    Added Kan, “Purchase applications were 10 percent higher than the same week a year ago but were down over the week following decreases in conventional and FHA applications. The average loan size was $408,700, the smallest in a year, driven by lower average loan sizes across both conventional and government loan types.”
    ...
    The average contract interest rate for 30-year fixed-rate mortgages with conforming loan balances ($806,500 or less) decreased to 6.25 percent from 6.32 percent, with points decreasing to 0.57 from 0.59 (including the origination fee) for 80 percent loan-to-value ratio (LTV) loans.
    emphasis added
    Mortgage Purchase Index Click on graph for larger image.

    The first graph shows the MBA mortgage purchase index.

    According to the MBA, purchase activity is up 10% year-over-year unadjusted. 

    Red is a four-week average (blue is weekly).  

    Purchase application activity is still depressed, but solidly above the lows of 2023 and above the lowest levels during the housing bust.  

    Mortgage Refinance Index
    The second graph shows the refinance index since 1990.

    The refinance index increased from the bottom as mortgage rates declined, but is down from the recent peak in September as rates moved sideways.
  • Calculated Risk calculatedriskblog.com business calculated-risk economics finance housing 2026-01-07 01:04

    ↗

    Note: Mortgage rates are from MortgageNewsDaily.com and are for top tier scenarios. Wednesday: • At 7:00 AM ET, The Mortgage Bankers Association (MBA) will release the results for the mortgage purchase applications index. This will be two weeks of data. • At 8:15 AM, The ADP...

    Mortgage Rates Note: Mortgage rates are from MortgageNewsDaily.com and are for top tier scenarios.

    Wednesday:
    • At 7:00 AM ET, The Mortgage Bankers Association (MBA) will release the results for the mortgage purchase applications index. This will be two weeks of data.

    • At 8:15 AM, The ADP Employment Report for December. This report is for private payrolls only (no government). The consensus is for 50,000, up from -32,000 jobs added in November.

    • At 10:00 AM, Job Openings and Labor Turnover Survey for November from the BLS.

    • At 10:00 AM, the ISM Services Index for December.
  • Calculated Risk calculatedriskblog.com business calculated-risk economics finance housing 2026-01-06 18:21

    ↗

    The BEA reported that light vehicle sales were at 16.0 million in December on a seasonally adjusted annual basis (SAAR). This was up 1.9% from the sales rate in November, and down 4.9% from December 2024. Click on graph for larger image. This graph shows light vehicle sales...

    The BEA reported that light vehicle sales were at 16.0 million in December on a seasonally adjusted annual basis (SAAR). This was up 1.9% from the sales rate in November, and down 4.9% from December 2024.

    Vehicle SalesClick on graph for larger image.

    This graph shows light vehicle sales since 2006 from the BEA (blue) through December.

    Vehicle sales were over 17 million SAAR in March and April as consumers rushed to "beat the tariffs".

    Then sales were depressed in May and June. 

    Sales were boosted in August and September due to the termination of the EV credit at the end of September.

    Vehicle SalesThe second graph shows light vehicle sales since the BEA started keeping data in 1967.

    Sales in Decvember were slightly above the consensus forecast.

    Light vehicle sales were up 2.4% in 2025 compared to 2024.
  • Calculated Risk calculatedriskblog.com business calculated-risk economics finance housing 2026-01-06 15:54

    ↗

    This graph shows heavy truck sales since 1967 using data from the BEA. The dashed line is the December 2025 seasonally adjusted annual sales rate (SAAR) of 311 thousand. Note: "Heavy trucks - trucks more than 14,000 pounds gross vehicle weight." Click on graph for larger...

    This graph shows heavy truck sales since 1967 using data from the BEA. The dashed line is the December 2025 seasonally adjusted annual sales rate (SAAR) of 311 thousand.

    Note: "Heavy trucks - trucks more than 14,000 pounds gross vehicle weight."

    Heavy Truck Sales Click on graph for larger image.

    Heavy truck sales were at 311 thousand SAAR in December, down from 336 thousand in November, and down 32.5% from 461 thousand SAAR in December 2024.

    Sales were down 15.3% in 2025 compared to annual sales in 2024.

    Usually, heavy truck sales decline sharply prior to a recession, and sales have collapsed recently.
  • Freakonomics freakonomics.com blog business economics freakonomics 2022-12-16 15:00

    ↗

    To celebrate a wonderful year of production on all of the shows in our network, we asked our staff to choose their favorite episode of the year. Lyric Bowditch, Production Associate“Why Do Doctors Have to Play Defense?” from Freakonomics, M.D.After the Supreme Court...

    To celebrate a wonderful year of production on all of the shows in our network, we asked our staff to choose their favorite episode of the year.

    Lyric Bowditch, Production Associate
    “Why Do Doctors Have to Play Defense?” from Freakonomics, M.D.
    After the Supreme Court overturned Roe v. Wade, my feeds were flooded with content about it. This episode cut through the noise by offering a really important, mind-widening, and distinctly Freakonomical perspective on the issue that I hadn’t considered or encountered anywhere else. I find myself bringing it up in conversations often!

    Neal Carruth, Executive Vice President and General Manager
    “Has Globalization Failed?” from Freakonomics Radio
    Freakonomics Radio does not shy away from posing big, provocative questions. This episode starts with a question that might, at first blush, seem kind of boring or too abstract to be interesting. But through a charming conversation with a supremely knowledgeable guest, the law professor Anthea Roberts, you acquire the tools to answer for yourself the question of whether globalization has failed. This episode also does a good job of engaging with the back catalog of Freakonomics Radio since the show has covered this general topic in the past.

    Jeremy Johnston, Audio Engineer
    “Names,” from Off Leash
    Since my dog doesn’t seem to recognize his own name half the time, I was excited to learn something from this episode of Off Leash. It ended up being a really great insight into how dogs respond to their nicknames, differentiate vowel sounds, and identify their owners’ voices in crowded places. This is such a happy episode full of animal lovers talking about how they arrived at a name for their furry friends, and also takes us on a fun tour of Isabella Rossellini’s farm.

    Julie Kanfer, Senior Producer
    “Why Is Everyone Moving to Dallas?” from Freakonomics Radio
    I really enjoyed this two-part series and learned a lot about a place I’ve never been (Dallas) and a thing I didn’t know (that everyone is moving there). I found myself thinking about this episode/series a lot throughout the year, random bits of it popping into my brain when I least expected them to. It also really evoked a sense of place and of the people in that place; I felt like I was along for the ride (in that Uber in the pouring rain).

    Ryan Kelley, Associate Producer
    “What Is Sportswashing (and Does It Work)?” from Freakonomics Radio
    We don’t normally focus on current events on Freakonomics Radio (we like to give the economists time to play with the data and come up with something smart), but the new, Saudi-backed professional golf league was just too intriguing not to cover. When Phil Mickelson, Qatar, and Barbra Streisand all come up in the same conversation, it must be good.

    Alina Kulman, Production Associate
    “Can the Big Bad Wolf Save Your Life?” from Freakonomics Radio
    I loved how interdisciplinary this episode was — it’s about wildlife conservation, politics, literature, and also (of course) economics. It also has some pretty staggering statistics, like the fact that deer collisions cost about $10 billion in damages annually.

    Zack Lapinski, Senior Producer
    “Why Did You Marry That Person?” from Freakonomics Radio
    This episode has everything: sexual anthropology, Victorian era politics, divorce, Shakespeare, the dating app Raya, aristocratic romance, Bridgerton, and — of course — an economist.

    Morgan Levey, Senior Producer
    “A Rockstar Chemist and Her Cancer-Attacking ‘Lawn Mower’” from People I (Mostly) Admire
    Maybe it’s a little gauche to list your own show / an episode you produced, but I loved this episode with Carolyn Bertozzi. Rarely does someone so brilliant also have the ability to explain Nobel-prize winning science so clearly. She’s also cool as hell, and I’d really like to be friends with her.

    Rebecca Lee Douglas, Senior Producer
    “J***s C****t, Angela, Why Are You Such a F***ing Potty-Mouth?” from No Stupid Questions
    I saw that Morgan listed an episode of PIMA, so now I feel empowered to share an episode of NSQ. This show was so much fun. It was packed with interesting research, personal anecdotes, and lots and lots of jokes — basically, the ingredients for an incredible episode of NSQ. We received more listener emails/voice memos to this show than any other episode we’ve produced.

    Katherine Moncure, Associate Producer
    “Are N.F.T.s All Scams?” from Freakonomics Radio
    I loved that entire series (“What Can Blockchain Do For You?”) because it took a very complicated and opaque part of our economy — a part that’s highly polarized — and in classic Freakonomics fashion, broke it down into something that was actually understandable. N.F.T.s are especially mind boggling to me, but less so now. I would have to say though, my favorite part was not any of the clear, informative explanations, but rather when the Freakonomics crew and the artist Tom Sachs were chased out of Bryant Park for launching a rocket. Well worth the risk.

    Greg Rippin, Technical Director
    The “What Can Blockchain Do For You?” series, from Freakonomics Radio
    I feel that we did a really good job of explaining the different applications of crypto without coming across like we were trying to get listeners to (literally) buy into it. Plus, I got to leave my studio for a bit and get some fresh air in the park.

    The post Freakonomics Radio Network’s 2022 Staff Picks appeared first on Freakonomics.

  • Freakonomics freakonomics.com blog business economics freakonomics 2017-10-09 12:14

    ↗

    It should surprise no one, and delight everyone, that Richard Thaler has won this year’s Nobel in economics. Congratulations! Thaler is a big reason I personally got interested in economics. (I’ve known him quite a bit longer than I’ve known Steve Levitt.) He is everything to...

    It should surprise no one, and delight everyone, that Richard Thaler has won this year’s Nobel in economics. Congratulations!

    Thaler is a big reason I personally got interested in economics. (I’ve known him quite a bit longer than I’ve known Steve Levitt.) He is everything to be admired in a scholar and thinker: original, judicious, crafty, and more than a little sardonic. (My only gripe is that he turned me down years ago when I wanted to write a book with him.)

    Without Thaler, the world would know far, far less about the work of Kahneman and Tversky, as he was the earliest (and pretty much only) economist interested in harnessing the power of their decision-making research. Without Thaler, there is no way that behavioral economics would now be a standard tool in the arsenal of policymakers (and, of course, others).

    He has been featured on this blog many times over the years; you can sample those pieces here.

    He has also been on the Freakonomics Radio podcast a few times, including “Fighting Poverty With Actual Evidence” and “Should We Really Behave Like Economists Say We Do?”

    And here’s a N.Y. Times piece I wrote about Thaler and other behavioralists back in 2003, near the start of his “libertarian paternalism” push.

    Among his books: the influential Nudge; the revealing Misbehaving; and the oft-overlooked Winner’s Curse, which I happened to dip into just last week for fun, and as always got swept up in Thaler’s starkly sane view of the world.

    Well done, Economics Sciences Prize Committee, and well done, Dick Thaler!

    The post Congratulations to Nobel Laureate Richard Thaler! appeared first on Freakonomics.

  • Freakonomics freakonomics.com blog business economics freakonomics 2017-06-26 21:41

    ↗

    The Princeton economist Alan Krueger — he led the Council of Economic Advisers under Obama, and his research has been featured several times on Freakonomics.com — is among a group of scholars launching a new endeavor. It’s called the Music Industry Research Association, and...

    The Princeton economist Alan Krueger — he led the Council of Economic Advisers under Obama, and his research has been featured several times on Freakonomics.com — is among a group of scholars launching a new endeavor. It’s called the Music Industry Research Association, and they want you to come to their first conference, at UCLA, in August. Here’s their writeup:

    Starting with Alfred Marshall’s “superstar model” and continuing with Baumol’s Disease, a number of breakthroughs in economics have come from studying the music industry. The music business also provides a fun and easy way to engage students in economics. To promote cutting-edge research on the economics of music, a group of economists, including Alan Krueger, Joel Waldfogel and Julie Mortimer, has formed the Music Industry Research Association (MIRA).

    The goal of MIRA is to provide a forum for economists and other researchers to interact with one another and music industry professionals to study trends, developments, and challenges facing the music industry, and to provide access to data. MIRA will hold its first conference of researchers, industry leaders, and musicians on August 10–11, 2017, at the Luskin Conference Center at the University of California, Los Angeles. You can register for the conference here.

    The post Calling All Music-Industry Insiders and the Economists Who Love Them appeared first on Freakonomics.

  • Freakonomics freakonomics.com blog business economics freakonomics 2016-12-20 19:38

    ↗

    How can we at Freakonomics help you during the holidays? Here’s a few ideas: 1. We can provide inspiration for gifts for the “homo economicus” in your life. 2. When you’re making your year-end donations, we can help you consider the evidence for which programs work, and which...

    How can we at Freakonomics help you during the holidays? Here’s a few ideas:

    1. We can provide inspiration for gifts for the “homo economicus” in your life.

    2. When you’re making your year-end donations, we can help you consider the evidence for which programs work, and which don’t.

    3. No matter how far away you roam, we can entertain and educate your family for the entire trip home with Tell Me Something I Don’t Know.

    4. We can nudge you to look back at the year and be grateful — or at least appreciate your tailwinds.

    5. Whatever your resolutions are for the new year — whether it’s being “grittier” or more productive, winning more, or becoming great at just about anything —we can help you achieve them.

    The post Happy Everything, From Freakonomics appeared first on Freakonomics.

  • Freakonomics freakonomics.com blog business economics freakonomics 2016-11-02 00:53

    ↗

    A while back, we tried out a new idea on a special edition of Freakonomics Radio — a game show we called Tell Me Something I Don’t Know. You might remember it. It was so much fun that we decided to launch a whole new podcast series. It’s been in the works for a while and it’s...

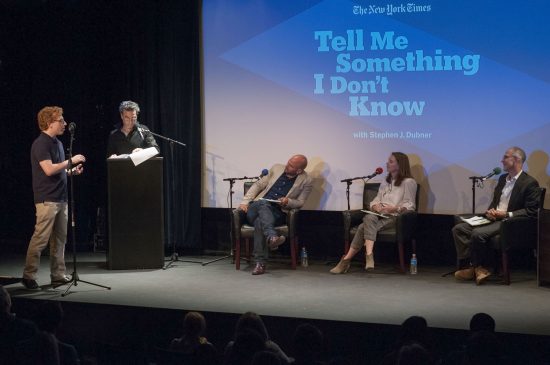
    TMSIDK stage

    A contestant tries to wow host Stephen J. Dubner and panelists Sam Kass, Gretchen Rubin and Zeke Emanuel. (Photo: Lucy Sutton.)

    A while back, we tried out a new idea on a special edition of Freakonomics Radio — a game show we called Tell Me Something I Don’t Know. You might remember it. It was so much fun that we decided to launch a whole new podcast series. It’s been in the works for a while and it’s finally here! A preview episode of the first season of TMSIDK is now available.

    Please take a minute to subscribe and, if you like the sound of the preview episode, please please PLEASE leave a rating and/or review on iTunes — it’s really important in helping launch a new show. twit-pic-tmsidk

    Like all the Freakonomics stuff we do, TMSIDK is still journalism, still factual — but disguised in the most sparkling conversation you can handle. In each episode, audience contestants get on stage and tell us something fascinating (or earth-shaking, or just plain weird) while a panel of three experts tries to sort out what’s worth knowing and what’s not.

    The panelists are drawn from an eclectic group of wise people — like Barnard College president Debora Spar; New York Public Library president Tony Marx; former White House economist Austan Goolsbee; the Jesuit writer and thinker James Martin; bioethicist Zeke Emanuel; former White House chef Sam Kass;  Microsoft researcher danah boyd; the heart surgeon and TV doctor Dr. Oz; poker champ Annie Duke; the linguist John McWhorter; the Grit author Angela Duckworth; and the happiness guru Gretchen Rubin.gethard-and-contestants

    We also have plenty of comedians and humorists, including Keisha Zollar, Chris Gethard, Frank Delaney, Andy Zaltzman, and Hannibal Buress. And occasionally a globetrotting adventurer like author Simon Winchester.

    sjdIt’s all hosted by Stephen J. Dubner, who is accompanied each night by a real-time human fact-checker to keep everyone (mostly) honest.

    Please subscribe today, so you don’t miss a single episode. The first one will be out on November 7. Season 1 will run six episodes — and we’re already taping Season 2 in New York City (in December and January), so come be a contestant or get tickets to see the show. You can also follow TMSIDK on Twitter, Facebook and Instagram.

    The post Announcing the Debut of Tell Me Something I Don’t Know appeared first on Freakonomics.

  • Freakonomics freakonomics.com blog business economics freakonomics 2016-04-28 22:28

    ↗

    In our recent Freakonomics Radio episode “How to Become Great at Just About Anything," we spoke with K. Anders Ericsson, a research psychologist who has spent more than 30 years studying expert performers in many fields — music, sports, chess, surgery, teaching, writing, and...

    In our recent Freakonomics Radio episode “How to Become Great at Just About Anything,” we spoke with K. Anders Ericsson, a research psychologist who has spent more than 30 years studying expert performers in many fields — music, sports, chess, surgery, teaching, writing, and more. Ericsson’s recent book is called Peak: Secrets from the New Science of Expertise. It has inspired us to try launching a Freakonomics spinoff podcast, called (for now) Peak.

    We’re recruiting participants who want to get really, really good at something and are willing to engage in “deliberate practice,” as prescribed by Ericsson. We’ll help set you up with a coach or teacher, and Ericsson will be our lead advisor. And then we’ll make some podcasts out of your stories. It will be hard work, maybe a bit embarrassing at times. But wouldn’t it be awesome to get really good at singing, or doing handstands, or whatever your heart yearns for — and to have your whole process recorded for posterity?

    If you’re up for it — truly up for it — and you want to be considered for our Peak project, drop us a note at radio@freakonomics.com. Tell us a little about yourself, what you want to get great at, and how far along you are in your progress.

    The post Calling All (Potential) Peak Performers! appeared first on Freakonomics.

  • Freakonomics freakonomics.com blog business economics freakonomics 2016-01-07 16:46

    ↗

    When Stephen Dubner’s new podcast Question of the Day launched in August, it immediately shot to No. 1 on the iTunes chart. Last month it was selected as one of iTunes "Best of 2015." (You can subscribe here.) Now you can come see a live taping of the show on Thursday,...

    HWL_QOTD_Cover_1600x1600_Update012016_FinalWhen Stephen Dubner’s new podcast Question of the Day launched in August, it immediately shot to No. 1 on the iTunes chart. Last month it was selected as one of iTunes “Best of 2015.” (You can subscribe here.) Now you can come see a live taping of the show on Thursday, January 14, at The Bell House in Brooklyn. Join Dubner, his Question of the Day co-host, James Altucher, and their special guest Negin Farsad for an evening of conversation that will run from the ridiculous to the sublime (and occasionally both).

    The concept of Question of the Day is simple: Dubner and Altucher take turns asking each other a question — for instance: “What are the secrets of being likable?” “What is the best possible future discovery or invention?“ “What social norms will be considered immoral in 100 years?” In the blink of an eye, their conversation will range from fact-based reality to unapologetic dogma.

    With Dubner and Altucher, you never know where the conversation will go, or what you’ll learn. Throw in a live audience — and their questions — and the night is sure to be memorable, and a lot of fun.

    Buy tickets here. Or submit your own question for a chance to win two free tickets. Post it below in the comments section or tweet it @QOD.

    The post Win Free Tickets to See Dubner on Stage in Brooklyn on January 14 appeared first on Freakonomics.

  • Freakonomics freakonomics.com blog business economics freakonomics 2015-11-02 16:52

    ↗

    One of the best things about being a journalist is getting to ask questions. Stephen Dubner has been doing this for years, accumulating fascinating bits of knowledge, hidden insights, and wild stories. By now he knows at least a little bit about a lot of things. The post...

    HWL_QOTD_Cover_1600x1600_Update012016_FinalOne of the best things about being a journalist is getting to ask questions. Stephen Dubner has been doing this for years, accumulating fascinating bits of knowledge, hidden insights, and wild stories. By now he knows at least a little bit about a lot of things.

    Dubner has a friend who’s equally curious and who has also absorbed an enormous amount of information over the course of his eclectic career. James Altucher is an entrepreneur, investor and author. James also interviews people who intrigue him, for his James Altucher Show podcast.

    Not long ago, Dubner and Altucher started a podcast together called Question of the Day. It’s a continuation of the kind of fast-paced conversation these two smart, unconventional thinkers have been having for years over their long friendship and their long-running game of backgammon.

    The topics are wide-ranging but never superficial, deep but never heavy. The episodes are short — usually under 15 minutes — and full of useful information that’s also  entertaining. In a single episode you might hear about Anders Ericsson’s 10,000-hour rule, Steven Spielberg’s singular advice about casting a movie and why the key to a good golf game is leg strength. All that from asking the question “What are shortcuts to learning something quickly?”

    You can imagine the twists and turns when they ask “What are the secrets of being likable?” “Should you let your kids win at chess?” or “What is the best possible future discovery or invention?”

    It’s a safe bet that in no other podcast will you hear references to the business savvy of YouTube make-up artist sensation Michelle Phan, the improbable story of how a podcasting start-up called Odeo morphed into Twitter, and the writing habits of Stephen King.

    We like to say that QOD is for people who are long on curiosity and short on time. We’re guessing anyone who’s a fan of Freakonomics would fit into that category. So check out Question of the Day. You can subscribe to it on iTunes and also hear it on Earwolf, Soundcloud and Stitcher. And you can follow QOD on Twitter and Facebook.

    The post Introducing “Question of the Day,” a New Dubner Podcast appeared first on Freakonomics.

  • Freakonomics freakonomics.com blog business economics freakonomics 2015-10-28 15:30

    ↗

    Many people have written many nice things to us over the years. (Of course some people have written some not-so-nice things too.) But the following is my favorite, or at least my new favorite: The post Quite Possibly the Most Flattering E-Mail Ever appeared first on Freakonomics.

    Many people have written many nice things to us over the years. (Of course some people have written some not-so-nice things too.) But the following is my favorite, or at least my new favorite:

    Good afternoon Stephen,

    I am a psychologist by education and spend my professional life as a consultant in the field of higher education and an executive coach.  I spend my personal life as a mother, wife, sister, daughter, and friend.  In all these roles I: (1) have many opportunities to improve and (2) try to express my gratitude to those who help me.  It is for these two reasons that I send this email.

    I started listening to your podcasts because I liked your book, Freakonomics, and appreciate the opportunity to learn about things that I don’t have the time to study myself.  For the work that you and your collaborators do researching and telling interesting and informative stories, I am grateful, as I had expected to be.  This email, though, is about something else.

    Because many people are quick to stop listening to anybody who holds a differing perspective, I have been taken by the curious and open-minded way in which you discuss topics with others.  Sometimes I am good at this, while other times my mannerisms and my tone give me away — exposing the fact that I’m not doing a great job of learning about an opposing view.  This is a skill that I would like to improve and one that I hope my children (11 and 9-years-old) develop.  So, using your podcasts as a model, our family is working on asking questions and constructing responses in a curious and open-minded way.  And, we have turned your last name into a verb…

    dubner (verb): to engage in a curious and open-minded conversation​.

    It is for this reason that I write to express my unexpected gratitude.​

    With kind regards and sincere appreciation,

    Kara E. Penfield, Ph.D.
    President, Penfield Consulting Group

    Thanks, Kara. I am truly flattered! The only problem is that I don’t feel I really live up to the definition as well as I’d like — i.e., while I of course try to be as curious and open-minded as possible, I often find, on listening back to interviews, that my priors and biases are stronger than I realized in the moment. So I am constantly looking for ways to dislodge them. Maybe having my name attached to this pursuit will be just the incentive I need!

    The post Quite Possibly the Most Flattering E-Mail Ever appeared first on Freakonomics.

  • Freakonomics freakonomics.com blog business economics freakonomics 2015-07-17 15:36

    ↗

    From a computer scientist (and self-professed “data nerd”) named Scott Griggs: Hi! Long time reader/listener here, looking for some quick reading list recommendations… I have submitted another application to be on CBS’s Survivor, the reality show of outwit, outplay, outlast...

    From a computer scientist (and self-professed “data nerd”) named Scott Griggs:

    Hi!  Long time reader/listener here, looking for some quick reading list recommendations…

    I have submitted another application to be on CBS’s Survivor, the reality show of outwit, outplay, outlast fame.  The game is physical as well as mental and includes a large social aspect concerning relationships, building trust, evaluating motives, and building/destroying alliances with other contestants.

    Do you have any reading recommendations you think could help if I ever get cast on the show?  So far, my short list of titles to consider rereading if I am cast for the show include How To Win Friends and Influence People, portions of Wiseman’s 59 Seconds (persuasion, motivation), and portions of Think Like a Freak (how to persuade people).

    You can watch Scott’s audition tape here. Okay, what is your reading advice for him?


    The post Any Strategic Reading Tips for a Survivor Applicant? appeared first on Freakonomics.

  • Freakonomics freakonomics.com blog business economics freakonomics 2015-06-09 17:00

    ↗

    We recently received the following e-mail from Yu Chen, a 29-year-old engineer supervisor in California who moved to the U.S. from China when she was 16. I listened to the episode on diamonds and asked my boyfriend for a gold bar for engagement instead. Then I heard the...

    We recently received the following e-mail from Yu Chen, a 29-year-old engineer supervisor in California who moved to the U.S. from China when she was 16.

    I listened to the episode on diamonds and asked my boyfriend for a gold bar for engagement instead. Then I heard the episode on quitting, so I broke up with him. I’ve been very happy ever since! Thank you for the awesome podcasts!

    Nice to see that we are getting results!

    I followed up with Yu by e-mail and this is what she had to say:

    Recently my family has been pressuring me to find someone. So I try to apply what I know to dating. I was ecstatic when I heard the episode on online dating. I used match.com to meet my two previous boyfriends. I used a screening system where “candidates” must be able to produce meaningful conversations with me via email for two weeks prior to the “interview.” Then I staked the interviews. I met as much as three candidates a week. I realize it’s a two-way choice. We make our selections within the first three dates. This allowed me to meet the most qualifying candidates in a short amount of time.

    I thank Freakonomics and TED Talks for my recent break up. Freakonomics told me that I would be less likely to regret if I were to quit. TED Talks said I should reject everyone within the first 37% of my dating window and marry the next best thing. So I shall reject everyone I meet before 28.7. I’m on the right track.

    The post Do We Owe This Boyfriend an Apology? appeared first on Freakonomics.

  • Freakonomics freakonomics.com blog business economics freakonomics 2015-05-01 19:00

    ↗

    Almost a decade of blogging had worn me down, but after some time off, I'm ready to jump back in the saddle. I can't think of a better way than by embarrassing myself with the annual Kentucky Derby predictions! The post The Annual Freakonomics Kentucky Derby Predictions...


    (Photo: Florian Christoph)

    (Photo: Florian Christoph)

    Almost a decade of blogging had worn me down, but after some time off, I’m ready to jump back in the saddle. I can’t think of a better way than by embarrassing myself with the annual Kentucky Derby predictions!

    I can’t remember the last time I was so excited about a Kentucky Derby.

    It’s not that there is some particular horse that I have an emotional attachment to it.  It is not that there is a particularly compelling story line going into this year’s race.

    Nope.  The reason is that I am a gambler, and unlike most years, the numbers coming out of my model are telling me that I should bet a whole lot of money on this year’s derby.

    There are two likely betting favorites in this year’s race: American Pharaoh and Dortmund.  Favorites tend to be the smart bets in horse racing because of a very pronounced “long shot” bias.  On average, bettors are much too optimistic about the winning chances of the long shots relative to the favorites.  Because the odds are determined by the bettors, the smart thing to do is usually to stick with favorites.

    My model, quite unusually, dislikes both favorites in this year’s Kentucky Derby.  If I’m right (and those who follow my annual predictions know that I rarely am), that means there is a good chance that the top three or four finishers might all be long shots.  Which means that the potential payoffs on what are called “exotic” bets (e.g. picking the top three finishers in the exact order) could be huge.  Which, as a gambler, gets me excited!

    My single favorite horse is Upstart, who will likely have odds of about 15-1.

    I also like Tencendur, Bolo and  Materiality.  And if you want a real long shot — try Itsaknockout…but I am guessing he will be 80-1 when the final odds are determined.

    I always try to predict the horse that will finish last as well (most notably Mine That Bird).  My model doesn’t see any real stinkers this year.  But if I had to pick one bad horse, it would be Mr. Z.

    If you are looking to bet the Derby, I have some good friends who have built a cool company that tries to make it fun and easy for novices to bet on horses.  It’s called Derby Jackpot.  (I have no financial interest in Derby Jackpot, but my friends do, and they would really like you to come and bet with them.)

    Good luck!

    The post The Annual Freakonomics Kentucky Derby Predictions appeared first on Freakonomics.

  • Freakonomics freakonomics.com blog business economics freakonomics 2015-04-16 19:40

    ↗

    In celebration of the 10th anniversary of Freakonomics comes this curated collection from the most readable economics blog in the universe. When Freakonomics was first published, its authors, Steven D. Levitt and Stephen J. Dubner, started a blog — and they’ve kept it up. The...

    WTRAB Out 5515

     Pre-order your copy today!

    In celebration of the 10th anniversary of Freakonomics comes this curated collection from the most readable economics blog in the universe. When Freakonomics was first published, its authors, Steven D. Levitt and Stephen J. Dubner, started a blog — and they’ve kept it up. The writing is more casual, more personal, even more outlandish than in their books. In When to Rob a Bank, they ask a host of typically off-center questions: Why don’t flight attendants get tipped? If you were a terrorist, how would you attack? And why does KFC always run out of fried chicken?

    Dubner and Levitt wound up publishing more than 8,000 blog posts on Freakonomics.com. Many of them, they freely admit, were rubbish. But now they’ve gone through and picked the best of the best. You’ll discover what people lie about, and why; the best way to cut gun deaths; why it might be time for a sex tax; and, yes, when to rob a bank. (Short answer: never; the ROI is terrible.) You’ll also learn a great deal about Levitt and Dubner’s own quirks and passions, from gambling and golf to backgammon and the abolition of the penny.

    Below you can read an early excerpt of When to Rob a Bank, comprising the introduction and first chapter. Enjoy!

    WTRB EXCERPT

    The post Read an Early Excerpt from When to Rob a Bank appeared first on Freakonomics.

  • Freakonomics freakonomics.com blog business economics freakonomics 2015-03-31 16:47

    ↗

    In a new working paper, Roland Benabou, Davide Ticchi, and Andrea Vindigni follow up their earlier paper which found "a robust negative association between religiosity and patents per capita." Their new paper, "Religion and Innovation" (abstract; PDF), they look at...

    In a new working paper, Roland Benabou, Davide Ticchi, and Andrea Vindigni  follow up their earlier paper which found “a robust negative association between religiosity and patents per capita.” Their new paper, “Religion and Innovation” (abstract; PDF), they look at religiosity on the individual level, “examining the relationship between religiosity and a broad set of pro- or anti-innovation attitudes.”

    What do they find?

    Across the fifty-two estimated specifications, greater religiosity is almost uniformly and very significantly associated to less favorable views of innovation.

    They are careful to note the broad benefits of religiosity on the social fabric:

    Guiso, Sapienza and Zingales (2003), using the World Values Survey (WVS), found more religious persons to be more trusting – of other people, public institutions, and market outcomes– as well as more trustworthy: less willing to break the law, accept a bribe, cheat on taxes, and the like. Theoretical models, similarly, have emphasized how beliefs in divine rewards and punishments (or a Calvinistic desire to self-signal one’s predestined fate) can induce individuals to behave less opportunistically and more cooperatively, which can in turn make such beliefs self-sustaining at the social level.

    Religiosity thus seems to be associated to what Guiso et al. describe as certain “societal attitudes… conducive to higher productivity and growth.”

    But:

    The ultimate driver of long-run growth, on the other hand, is technical progress and more generally the whole spectrum of innovation: from advances in basic science to the diffusion of new technologies (e.g., Mokyr (2004)), economic practices and even social change, such as the inclusion of women in production and idea-creation. It therefore seems equally important to examine the extent to which religious beliefs, values and institutions may be conducive or detrimental to creativity and innovation. Doing so means, in a sense, revisiting with modern methodologies the age-old theme of religion’s often tense relationship with science, free thought and disruptively novel ideas.

    And so they revisit this theme, and reach this conclusion:

    Using all five waves of the World Values Survey, we examined the relationships between eleven indicators of openness to innovation, broadly defined (e.g., attitudes toward science and technology, new versus old ideas, general change, personal risk taking and agency, imagination and independence in children) and five measures of religiosity, involving both beliefs and attendance. Across the fifty-two regression specifications (with controls for sociodemographics, country and year), greater religiosity was almost uniformly and very significantly associated to less favorable views of innovation. In follow-up work, we plan to examine differences in these attitudes across denominations.


    The post Religiosity: Good for Society, Bad for Innovation? appeared first on Freakonomics.

  • Freakonomics freakonomics.com blog business economics freakonomics 2015-03-31 14:31

    ↗

    A reader writes in with a question that is hard to answer. I thought it'd be best to put the question to you, our readers; hopefully you can help him find his way to a good decision. The post Should I Work for an “Evil” Company? appeared first on Freakonomics.

    A reader writes in with a question that is hard to answer. I thought it’d be best to put the question to you, our readers; hopefully you can help him find his way to a good decision.

    Hello:

    I am an academic plant geneticists, who has worked at [a renowned academic institution] for the last five years. I’ve pretty much decided I want to leave academia but remain in science. The obvious direction to then go into is biotech and I think I could be a good fit for it. There are many options for me in biotech and I’ve applied for many jobs. The company that has been the most responsive to me is Monsanto.

    I’m sure Monsanto would be a great employer for the reasons I would like to work in biotech (stability, good pay/benefits and collaboration). However it is seen by most as perhaps the most “evil” company. I’m confident I would lose a lot of friends if I did work for them. Also, I doubt I would dare tell strangers that I worked for them.

    I’m not decided on how I feel about the company myself. I think they have done some messed-up things in the past but so have most large corporations. I’m more pro-GMO than most but also have my reservations. I understand the need for a company to patent seeds. I doubt I would be doing evil work for them and would not do it if I knew I was.

    I wonder if you would find it of interest to look into the ways people decide to work for companies that most people hate. I doubt all those people are dead inside. Maybe most people can easily make the decision to work for famously “evil” companies or not but I can’t see it as obviously black or white.

    The post Should I Work for an “Evil” Company? appeared first on Freakonomics.

  • Freakonomics freakonomics.com blog business economics freakonomics 2015-03-30 20:22

    ↗

    From a reader named John Keaney: I just finished your book Think Like a Freak, and I’m trying to use the lessons in the book while I’m in Kyrgyzstan. I’m an undergraduate at University of South Carolina, and I’ve decided to pursue my very first, independent research project...

    From a reader named John Keaney:

    I just finished your book Think Like a Freak, and I’m trying to use the lessons in the book while I’m in Kyrgyzstan. I’m an undergraduate at University of South Carolina, and I’ve decided to pursue my very first, independent research project while I’m living in Kyrgyzstan on the effects of Kyrgyz accession to the Eurasian Economic Union on the Kyrgyz informal economy and, ultimately, Kyrgyzstan’s political stability.

    I’m almost ready to go out to the bazaars and do my data collection, but I’ve been trying to pick the best possible questions to ask the people working in the stalls. Thus far I’ve been focusing on questions regarding past prices and what they expect in the future, what they feel the EEU’s effect will be on them, how much they depend on bazaar money, whether or not they have any sons that are migrant workers (and if they’ll be returning home soon), etc.

    I’ve been struggling to come up with a good Freakonometric for the questionnaire, but I’ve been struggling to find an unusual, but important, common thread between the EEU, bazaars, household income, etc. and was wondering if you would have any advice for this filthy undergrad.

    Who can give John a good suggestion or two?

    The post A Would-Be Freakonomist in Kyrgyzstan Needs Your Help appeared first on Freakonomics.

  • Freakonomics freakonomics.com blog business economics freakonomics 2015-03-30 16:09

    ↗

    We’ll be putting out a new Freakonomics Radio episode later this week on the use of RCTs (randomized controlled trials) in healthcare delivery. It features the work of the MIT economist Amy Finkelstein and her colleagues at J-PAL, and it includes their analysis of what...

    We’ll be putting out a new Freakonomics Radio episode later this week on the use of RCTs (randomized controlled trials) in healthcare delivery. It features the work of the MIT economist Amy Finkelstein and her colleagues at J-PAL, and it includes their analysis of what happened when Oregon expanded its Medicaid coverage.

    If you want to get a head start on this topic, consider a new working paper (gated) called “Does Medicaid Coverage for Pregnant Women Affect Prenatal Health Behaviors?” The authors are Dhaval M. Dave, Robert Kaestner, and George L. Wehby. They didn’t use an RCT, but they did work hard to answer a tough and worthwhile question in the realm of healthcare delivery. Their conclusion, bolded in the abstract below, is quite counterintuitive (and surely, to some at least, depressing):

    Despite plausible mechanisms, little research has evaluated potential changes in health behaviors as a result of the Medicaid expansions of the 1980s and 1990s for pregnant women. Accordingly, we provide the first national study of the effects of Medicaid on health behaviors for pregnant women. We exploit exogenous variation from the Medicaid income eligibility expansions for pregnant women and children during late-1980s through mid-1990s to examine effects on several prenatal health behaviors and health outcomes using U.S. vital statistics data. We find that increases in Medicaid eligibility were associated with increases in smoking and decreases in weight gain during pregnancy. Raising Medicaid eligibility by 12 percentage-points increased rates of any prenatal smoking and smoking more than five cigarettes daily by 0.7-0.8 percentage point. Medicaid expansions were associated with a reduction in pregnancy weight-gain by about 0.6%. These effects diminish at higher levels of eligibility, which is consistent with crowd-out from private to public insurance. Importantly, our evidence is consistent with ex-ante moral hazard although income effects are also at play. The worsening of health behaviors may partly explain why Medicaid expansions have not been associated with substantial improvement in infant health.

    Just to be clear, weight gain is a good thing when you’re pregnant; and smoking 5 more cigarettes a day is not. Here’s how the authors attempt to explain their finding:

    One possible explanation for this somewhat counterintuitive finding is that health insurance creates incentives to change health behaviors along with lowering the price of medical care. Insurance lowers the price of treating an illness, for example, an adverse medical outcome for either the mother or child, which may cause a reduction in maternal efforts to prevent the occurrence of such events (ex-ante moral hazard).

    In addition, Medicaid coverage entails an income effect from the saved out-of-pocket expenditures and from spending on health insurance premiums (in the case of substitution of private for public insurance). This income effect may be used to purchase goods that improve infant health, but also goods that may harm infant health (e.g., cigarettes).

    Incentives, incentives, incentives.

    The post What Happens When Poor Pregnant Women Are Given Medicaid Coverage? appeared first on Freakonomics.

  • Freakonomics freakonomics.com blog business economics freakonomics 2015-02-23 17:26

    ↗

    From a podcast listener named Jessica Graham in Sydney, Australia: My name is Jess and for most of my adult life I have been afflicted by various forms of sleeplessness. Would I call it insomnia? I don’t know if it could be classified as clinical insomnia, but all I can say...

    From a podcast listener named Jessica Graham in Sydney, Australia:

    My name is Jess and for most of my adult life I have been afflicted by various forms of sleeplessness.

    Would I call it insomnia? I don’t know if it could be classified as clinical insomnia, but all I can say is up until a few months ago I did dread that point in the night where you turn off the light (where normal people drop off to sleep within a matter of minutes) and where, I, on the other hand, would spend many hours tossing and turning as my brain would come up with a thousand and one things to ruminate over instead of journeying peacefully to the land of nod.

    What happened to change this dire situation you ask? I now religiously download my Freakonomics podcasts well in advance, pop my headphones on, tune in with anticipation as invariably my mind slowly melds into a soft fuzzy somnambulistic state as I listen to the dulcet tones of Stephen J. Dubner!

    SO THANKYOU 🙂

    The post New Miracle Sleep Aid Discovered! appeared first on Freakonomics.

  • Freakonomics freakonomics.com blog business economics freakonomics 2015-02-11 18:06

    ↗

    My good friend and colleague John List has very ambitious summer plans. We’ve both believed for a long time that the combination of creative economic thinking and randomized experiments has the potential to revolutionize business and the non-profit sector. John and I have...

    My good friend and colleague John List has very ambitious summer plans.

    We’ve both believed for a long time that the combination of creative economic thinking and randomized experiments has the potential to revolutionize business and the non-profit sector. John and I have worked to foment that revolution through both  academic partnerships with firms as well as a project of John’s called the Science of Philanthropy Initiative (SPI), whose mission is “evidence-based research on charitable giving.”

    This summer, John is committed to taking that mission to a whole new level with the first annual University of Chicago Summer Institute on Field Experiments.  The idea is to bring together for one week top economists, business leaders, and NGOs with the goal of developing powerful, creative solutions to the toughest problems faced by firms, whether for-profit or not-for-profit.

    In addition to lots of brainstorming and work focused on firms’ problems, there will be presentations by John, me, and other leading scholars. Knowing John, I’m sure there will also be plenty of after-hours activities.

    Here’s how the website describes the sort of people we are looking for:

    The Summer Institute is looking for practitioner partners who are open to new and bold ideas that will revolutionize the way they develop policy, do business, or provide charitable programming. Practitioner partners should be willing to work closely with researchers to field-test solutions, and must be willing to allow research publications to come from the partnership. We expect the Institute to serve as a catalyst for field-experiment research and strong researcher-practitioner partnerships.

    So if you or someone you know might be a good candidate, please apply!  You can find the details on the Institute website.

    We can’t wait to meet you and get started!

    The post Great Companies Needed appeared first on Freakonomics.

  • Freakonomics freakonomics.com blog business economics freakonomics 2015-02-11 15:13

    ↗

    We're working on an episode about behavior change -- essentially, how to get yourself to do the things you should be doing but often don't. It revolves around the fascinating research of Katy Milkman at Penn. For example, she and her colleagues have noted a "Fresh Start...

    We’re working on an episode about behavior change — essentially, how to get yourself to do the things you should be doing but often don’t. It revolves around the fascinating research of Katy Milkman at Penn. For example, she and her colleagues have noted a “Fresh Start Effect”:

    The popularity of New Year’s resolutions suggests that people are more likely to tackle their goals immediately following salient temporal landmarks. … We propose that these landmarks demarcate the passage of time, creating many new mental accounting periods each year, which relegate past imperfections to a previous period, induce people to take a big-picture view of their lives, and thus motivate aspirational behaviors.

    What we’re looking for are your examples of fresh starts — whether it’s a new timeframe, job, relationship, living situation, etc. — and how it may have motivated some aspirational behaviors of your own.

    Use your iPhone, Android, or other recording device to make a short audio recording of your answer and e-mail the file to radio@freakonomics.com. Tell us your name, where you live,  what you do — and, most important, your Fresh Start story. We’ll pick through the best, weirdest examples and make them a part of our show. If you’re too shy to record your voice, give us a shout on Twitter, on our Facebook page, or in the comments below. But audio is what we’re really after.

    Many thanks!

    The post Lend Your Voice to Freakonomics Radio appeared first on Freakonomics.

  • End of feed
Maibook — your private personalized AI community
  • rcanand.com
  • mlaillc.com
  • @rcanand (X)
  • LinkedIn
  • Feedback
  • Credits